Summary
This article links together two recent academic research pieces and describes strategies that may capture the findings of these works.
Skewness in stock returns and the lower tendency of dividend payers to experience stock crashes both fit into a narrative around the types of companies that outperform long term.
The article illustrates that stable dividend payers have been among the small number of companies that have generated the bulk of shareholder wealth in the United States.
 I have written two recent articles on fascinating, recently published academic research. In my article "Why Many Investors Fail", I described research that showed that the equity risk premium in the United States has been historically attributable to only a small number of stocks whose outstanding performance skewed average returns higher. In "Dividends and Stock Crashes," I described research that showed that dividend-paying stocks are less prone to large stock price corrections. Both of these papers are interesting on a standalone basis, but I believe they are even more powerful for Seeking Alpha readers when considered together.
Why Many Investors Fail
Arizona State University's Henrick Bessembinder's "Do Stocks Outperform Treasury Bills?" is a fascinating paper. We know that the simple answer to the titular question is a resounding "Yes." Over long time intervals, the equity market has, on average, paid an investor a premium for taking equity risk.
In tracking nearly 26,000 stocks, Bessembinder found that a whopping 58% of stocks failed to outperform Treasury bills over their lifetimes in the dataset. On average, stocks outperform over long time intervals, but the median stock in the U.S. equity market has actually produced negative alpha, an average return that trailed risk-free Treasury bills. That's not the type of alpha we are collectively seeking, and this stat should be of great interest to stock pickers out there.
Bessembinder's paper is essentially on skewness, and the idea behind why the stock market has generated long-run excess returns, but most stocks have not produced a better return than bonds. It makes intuitive sense. Over very long time intervals, the maximum you are going to lose is 100%, but cumulative gains can be astronomical. The right tail of the distribution is much longer. Unfortunately, the most common cumulative return over a decade-long holding period for stocks in the database is -100%. The positive excess returns for the market are a function of that long right tail.
Dividends and Stock Crashes
Over a long enough time period, companies go out of business. In "Dividend Payments and Stock Price Crash Risk," authored by Jeong-Bon Kim of University of Waterloo, Le Luo of Huazhong University of Science and Technology, and Hong Xie of the University of Kentucky, the authors demonstrated the negative correlation between dividend payments and stock price crashes. The paper suggested that a firm's commitment to dividend payments reduces agency costs and lowers the risk of large-scale stock price drops. It stands to reason that companies not experiencing large-scale price drops are more likely to make it into the hallowed right tail.
While this data in this article was based on weekly returns, I believe there are still long-run implications. In Bessembinder's article, he listed in the exhibits the 30 best-performing stocks in the dataset stretching from 1926-2015 as excerpted below:
I have written two recent articles on fascinating, recently published academic research. In my article "Why Many Investors Fail", I described research that showed that the equity risk premium in the United States has been historically attributable to only a small number of stocks whose outstanding performance skewed average returns higher. In "Dividends and Stock Crashes," I described research that showed that dividend-paying stocks are less prone to large stock price corrections. Both of these papers are interesting on a standalone basis, but I believe they are even more powerful for Seeking Alpha readers when considered together.
Why Many Investors Fail
Arizona State University's Henrick Bessembinder's "Do Stocks Outperform Treasury Bills?" is a fascinating paper. We know that the simple answer to the titular question is a resounding "Yes." Over long time intervals, the equity market has, on average, paid an investor a premium for taking equity risk.
In tracking nearly 26,000 stocks, Bessembinder found that a whopping 58% of stocks failed to outperform Treasury bills over their lifetimes in the dataset. On average, stocks outperform over long time intervals, but the median stock in the U.S. equity market has actually produced negative alpha, an average return that trailed risk-free Treasury bills. That's not the type of alpha we are collectively seeking, and this stat should be of great interest to stock pickers out there.
Bessembinder's paper is essentially on skewness, and the idea behind why the stock market has generated long-run excess returns, but most stocks have not produced a better return than bonds. It makes intuitive sense. Over very long time intervals, the maximum you are going to lose is 100%, but cumulative gains can be astronomical. The right tail of the distribution is much longer. Unfortunately, the most common cumulative return over a decade-long holding period for stocks in the database is -100%. The positive excess returns for the market are a function of that long right tail.
Dividends and Stock Crashes
Over a long enough time period, companies go out of business. In "Dividend Payments and Stock Price Crash Risk," authored by Jeong-Bon Kim of University of Waterloo, Le Luo of Huazhong University of Science and Technology, and Hong Xie of the University of Kentucky, the authors demonstrated the negative correlation between dividend payments and stock price crashes. The paper suggested that a firm's commitment to dividend payments reduces agency costs and lowers the risk of large-scale stock price drops. It stands to reason that companies not experiencing large-scale price drops are more likely to make it into the hallowed right tail.
While this data in this article was based on weekly returns, I believe there are still long-run implications. In Bessembinder's article, he listed in the exhibits the 30 best-performing stocks in the dataset stretching from 1926-2015 as excerpted below:
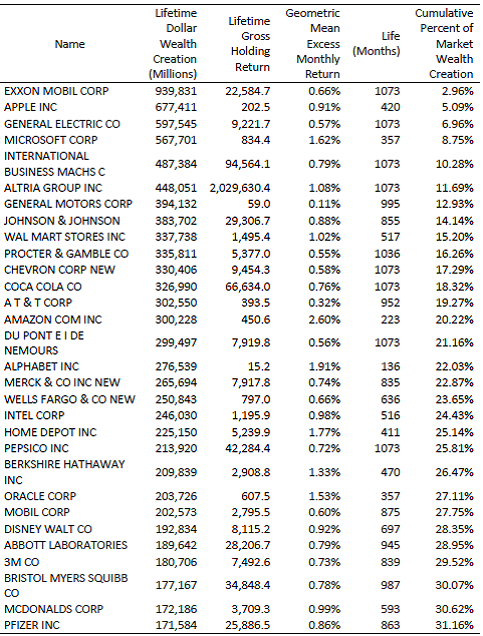 These 30 stocks have cumulatively generated nearly one-third of the total wealth creation from U.S. stocks over a period pre-dating the Great Depression.
It should come as no surprise that this list is populated by royal blue-chips. A company would need to have grown into a market leader to rank highly on this list. Another interesting observation from this table is the commonality in the other lists that these companies populate.
From this list of 30 companies, 3M (NYSE:MMM), Abbott Labs (NYSE:ABT), AT&T (NYSE:T), Chevron (NYSE:CVX), Coca-Cola (NYSE:KO), Exxon Mobil (NYSE:XOM), Johnson & Johnson (NYSE:JNJ), McDonald's (NYSE:MCD), PepsiCo (NYSE:PEP), Proctor & Gamble (NYSE:PG), and Wal-Mart (NYSE:WMT) are all members of the Dividend Aristocrats (NOBL, SDY). Counting both Exxon and Mobil, 40% of this list is populated by companies that have at least a 25-year history of increasing dividend payments to shareholders. This type of consistent dividend growth has been one of my 5 Ways to Beat the Market. Companies with the discipline and financial wherewithal to return increasing amounts of cash to shareholders over multiple business cycles are likely to be in the right tail of the distribution, where you can bet on seeing compounding returns over long-time intervals.
Another one of my preferred dividend strategies is to focus on low-volatility, high-dividend companies (NYSEARCA:SPHD). Abbott spin-off AbbVie (NYSE:ABBV), AT&T, Chevron, Coca-Cola, Exxon Mobil, General Electric (NYSE:GE), General Motors (NYSE:GM), International Business Machines (NYSE:IBM), Merck (NYSE:MRK), Pfizer (NYSE:PFE), and Proctor & Gamble are each part of the 50-member S&P 500 Low Volatility High Dividend Index, which tracks the 50 lowest-volatility members of the 75 highest-dividend paying S&P 500 constituents. Companies that pay sustainable levels of dividends and have lower realized volatility are less likely to experience stock crashes and more likely to experience compounding returns.
There are some notable exceptions in this table. Berkshire Hathaway (BRK.A, BRK.B) has never paid a dividend, choosing to reinvest the cash flow its operating businesses and investments generate. Alphabet (NASDAQ:GOOGL) also does not pay a dividend. Both companies have the balance sheet and capacity to pay steadily increasing dividends, but have chosen not to follow this path. They are, however, exceptions and not the rule.
The takeaways from these two research pieces are that an outsized portion of the equity risk premium is a function of very high long-run returns from a small number of stocks. Those stocks tend to be high-quality dividend payers which are less prone to stock crashes. Both of the dividend strategies I described in this article have handsomely outperformed the S&P 500 over time with lower variability of returns. These strategies are populated by long-run stable dividend payers that typically avoid crashes and compound successfully over time.
Disclaimer: My articles may contain statements and projections that are forward-looking in nature, and therefore inherently subject to numerous risks, uncertainties and assumptions. While my articles focus on generating long-term risk-adjusted returns, investment decisions necessarily involve the risk of loss of principal. Individual investor circumstances vary significantly, and information gleaned from my articles should be applied to your own unique investment situation, objectives, risk tolerance, and investment horizon.
Disclosure: I am/we are long SDY, SPHD, NOBL.
These 30 stocks have cumulatively generated nearly one-third of the total wealth creation from U.S. stocks over a period pre-dating the Great Depression.
It should come as no surprise that this list is populated by royal blue-chips. A company would need to have grown into a market leader to rank highly on this list. Another interesting observation from this table is the commonality in the other lists that these companies populate.
From this list of 30 companies, 3M (NYSE:MMM), Abbott Labs (NYSE:ABT), AT&T (NYSE:T), Chevron (NYSE:CVX), Coca-Cola (NYSE:KO), Exxon Mobil (NYSE:XOM), Johnson & Johnson (NYSE:JNJ), McDonald's (NYSE:MCD), PepsiCo (NYSE:PEP), Proctor & Gamble (NYSE:PG), and Wal-Mart (NYSE:WMT) are all members of the Dividend Aristocrats (NOBL, SDY). Counting both Exxon and Mobil, 40% of this list is populated by companies that have at least a 25-year history of increasing dividend payments to shareholders. This type of consistent dividend growth has been one of my 5 Ways to Beat the Market. Companies with the discipline and financial wherewithal to return increasing amounts of cash to shareholders over multiple business cycles are likely to be in the right tail of the distribution, where you can bet on seeing compounding returns over long-time intervals.
Another one of my preferred dividend strategies is to focus on low-volatility, high-dividend companies (NYSEARCA:SPHD). Abbott spin-off AbbVie (NYSE:ABBV), AT&T, Chevron, Coca-Cola, Exxon Mobil, General Electric (NYSE:GE), General Motors (NYSE:GM), International Business Machines (NYSE:IBM), Merck (NYSE:MRK), Pfizer (NYSE:PFE), and Proctor & Gamble are each part of the 50-member S&P 500 Low Volatility High Dividend Index, which tracks the 50 lowest-volatility members of the 75 highest-dividend paying S&P 500 constituents. Companies that pay sustainable levels of dividends and have lower realized volatility are less likely to experience stock crashes and more likely to experience compounding returns.
There are some notable exceptions in this table. Berkshire Hathaway (BRK.A, BRK.B) has never paid a dividend, choosing to reinvest the cash flow its operating businesses and investments generate. Alphabet (NASDAQ:GOOGL) also does not pay a dividend. Both companies have the balance sheet and capacity to pay steadily increasing dividends, but have chosen not to follow this path. They are, however, exceptions and not the rule.
The takeaways from these two research pieces are that an outsized portion of the equity risk premium is a function of very high long-run returns from a small number of stocks. Those stocks tend to be high-quality dividend payers which are less prone to stock crashes. Both of the dividend strategies I described in this article have handsomely outperformed the S&P 500 over time with lower variability of returns. These strategies are populated by long-run stable dividend payers that typically avoid crashes and compound successfully over time.
Disclaimer: My articles may contain statements and projections that are forward-looking in nature, and therefore inherently subject to numerous risks, uncertainties and assumptions. While my articles focus on generating long-term risk-adjusted returns, investment decisions necessarily involve the risk of loss of principal. Individual investor circumstances vary significantly, and information gleaned from my articles should be applied to your own unique investment situation, objectives, risk tolerance, and investment horizon.
Disclosure: I am/we are long SDY, SPHD, NOBL.
This article links together two recent academic research pieces and describes strategies that may capture the findings of these works.
Skewness in stock returns and the lower tendency of dividend payers to experience stock crashes both fit into a narrative around the types of companies that outperform long term.
The article illustrates that stable dividend payers have been among the small number of companies that have generated the bulk of shareholder wealth in the United States.
I have written two recent articles on fascinating, recently published academic research. In my article "Why Many Investors Fail", I described research that showed that the equity risk premium in the United States has been historically attributable to only a small number of stocks whose outstanding performance skewed average returns higher. In "Dividends and Stock Crashes," I described research that showed that dividend-paying stocks are less prone to large stock price corrections. Both of these papers are interesting on a standalone basis, but I believe they are even more powerful for Seeking Alpha readers when considered together.
Why Many Investors Fail
Arizona State University's Henrick Bessembinder's "Do Stocks Outperform Treasury Bills?" is a fascinating paper. We know that the simple answer to the titular question is a resounding "Yes." Over long time intervals, the equity market has, on average, paid an investor a premium for taking equity risk.
In tracking nearly 26,000 stocks, Bessembinder found that a whopping 58% of stocks failed to outperform Treasury bills over their lifetimes in the dataset. On average, stocks outperform over long time intervals, but the median stock in the U.S. equity market has actually produced negative alpha, an average return that trailed risk-free Treasury bills. That's not the type of alpha we are collectively seeking, and this stat should be of great interest to stock pickers out there.
Bessembinder's paper is essentially on skewness, and the idea behind why the stock market has generated long-run excess returns, but most stocks have not produced a better return than bonds. It makes intuitive sense. Over very long time intervals, the maximum you are going to lose is 100%, but cumulative gains can be astronomical. The right tail of the distribution is much longer. Unfortunately, the most common cumulative return over a decade-long holding period for stocks in the database is -100%. The positive excess returns for the market are a function of that long right tail.
Dividends and Stock Crashes
Over a long enough time period, companies go out of business. In "Dividend Payments and Stock Price Crash Risk," authored by Jeong-Bon Kim of University of Waterloo, Le Luo of Huazhong University of Science and Technology, and Hong Xie of the University of Kentucky, the authors demonstrated the negative correlation between dividend payments and stock price crashes. The paper suggested that a firm's commitment to dividend payments reduces agency costs and lowers the risk of large-scale stock price drops. It stands to reason that companies not experiencing large-scale price drops are more likely to make it into the hallowed right tail.
While this data in this article was based on weekly returns, I believe there are still long-run implications. In Bessembinder's article, he listed in the exhibits the 30 best-performing stocks in the dataset stretching from 1926-2015 as excerpted below:
These 30 stocks have cumulatively generated nearly one-third of the total wealth creation from U.S. stocks over a period pre-dating the Great Depression.
It should come as no surprise that this list is populated by royal blue-chips. A company would need to have grown into a market leader to rank highly on this list. Another interesting observation from this table is the commonality in the other lists that these companies populate.
From this list of 30 companies, 3M (NYSE:MMM), Abbott Labs (NYSE:ABT), AT&T (NYSE:T), Chevron (NYSE:CVX), Coca-Cola (NYSE:KO), Exxon Mobil (NYSE:XOM), Johnson & Johnson (NYSE:JNJ), McDonald's (NYSE:MCD), PepsiCo (NYSE:PEP), Proctor & Gamble (NYSE:PG), and Wal-Mart (NYSE:WMT) are all members of the Dividend Aristocrats (NOBL, SDY). Counting both Exxon and Mobil, 40% of this list is populated by companies that have at least a 25-year history of increasing dividend payments to shareholders. This type of consistent dividend growth has been one of my 5 Ways to Beat the Market. Companies with the discipline and financial wherewithal to return increasing amounts of cash to shareholders over multiple business cycles are likely to be in the right tail of the distribution, where you can bet on seeing compounding returns over long-time intervals.
Another one of my preferred dividend strategies is to focus on low-volatility, high-dividend companies (NYSEARCA:SPHD). Abbott spin-off AbbVie (NYSE:ABBV), AT&T, Chevron, Coca-Cola, Exxon Mobil, General Electric (NYSE:GE), General Motors (NYSE:GM), International Business Machines (NYSE:IBM), Merck (NYSE:MRK), Pfizer (NYSE:PFE), and Proctor & Gamble are each part of the 50-member S&P 500 Low Volatility High Dividend Index, which tracks the 50 lowest-volatility members of the 75 highest-dividend paying S&P 500 constituents. Companies that pay sustainable levels of dividends and have lower realized volatility are less likely to experience stock crashes and more likely to experience compounding returns.
There are some notable exceptions in this table. Berkshire Hathaway (BRK.A, BRK.B) has never paid a dividend, choosing to reinvest the cash flow its operating businesses and investments generate. Alphabet (NASDAQ:GOOGL) also does not pay a dividend. Both companies have the balance sheet and capacity to pay steadily increasing dividends, but have chosen not to follow this path. They are, however, exceptions and not the rule.
The takeaways from these two research pieces are that an outsized portion of the equity risk premium is a function of very high long-run returns from a small number of stocks. Those stocks tend to be high-quality dividend payers which are less prone to stock crashes. Both of the dividend strategies I described in this article have handsomely outperformed the S&P 500 over time with lower variability of returns. These strategies are populated by long-run stable dividend payers that typically avoid crashes and compound successfully over time.
Disclaimer: My articles may contain statements and projections that are forward-looking in nature, and therefore inherently subject to numerous risks, uncertainties and assumptions. While my articles focus on generating long-term risk-adjusted returns, investment decisions necessarily involve the risk of loss of principal. Individual investor circumstances vary significantly, and information gleaned from my articles should be applied to your own unique investment situation, objectives, risk tolerance, and investment horizon.
Disclosure: I am/we are long SDY, SPHD, NOBL.


 Dow Jones Data Group