Showing posts with label Dividend stocks. Show all posts

Monday, July 24, 2017

High Dividend Small Caps

Image result for High Dividend Small Caps stocks

Summary

This article examines the long-run performance of a strategy focused on low-volatility, high-dividend, small-cap stocks.
I have proven in past articles that this strategy in large caps has generated absolute and risk-adjusted outperformance versus the broader market.
The current vehicle replicating this index is currently too small and illiquid for me to invest.
The article lists the current 60 constituents of the index for readers to analyze potentially building their own portfolio.
Finally, the article discusses other lower-volatility and dividend growth small-cap strategies.
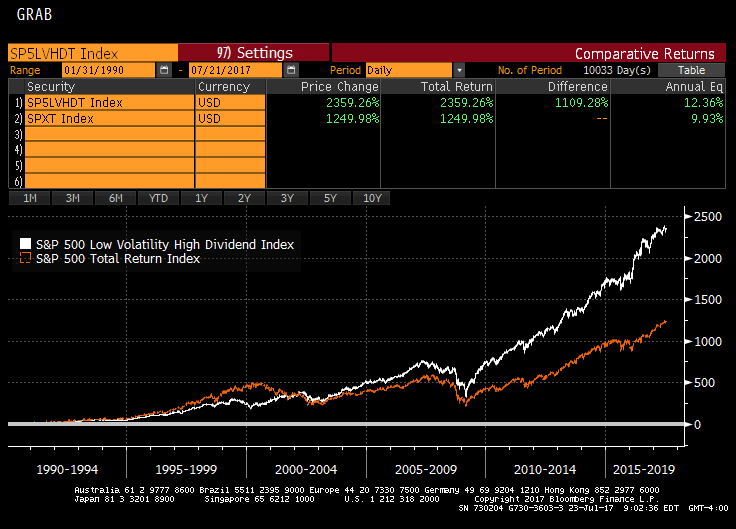
One of my favorite smart beta strategies selects from among the 75 highest dividend-paying S&P 500 (NYSEARCA:SPY) constituents, building a portfolio out of the 50 with the lowest realized volatility over the past year. As I showed in "A High Dividend Strategy That Works", this S&P 500 Low Volatility High Dividend Index, which is replicated by the PowerShares S&P 500 High Dividend Low Volatility Portfolio ETF (NYSEARCA:SPHD), has strongly outperformed the broader S&P 500 (SPY) over a sample period dating back to 1990.
Buoyed by the success of SPHD, which returned over 22% in 2016 including reinvested dividends, PowerShares has launched a small-cap cousin of that large-cap index. That index selects from among the 90 highest dividend-paying S&P 600 (NYSEARCA:IJR) constituents, building a portfolio out of the 60 with the lowest realized volatility over the past year. The index is weighted by dividend yield and includes sector caps.
The replicating fund, the PowerShares S&P SmallCap High Dividend Low Volatility Portfolio (BATS:XSHD) is a nascent fund launched in December 2016. It has only gathered $7 million of assets but continues to be a fund referenced to me by many readers on Seeking Alpha. This article will seek to examine whether this high-dividend, low-volatility segment of the small-cap universe generates alpha.
The chart below graphs the S&P 600 High Dividend Low Volatility Index versus the S&P 600 and the S&P 500.
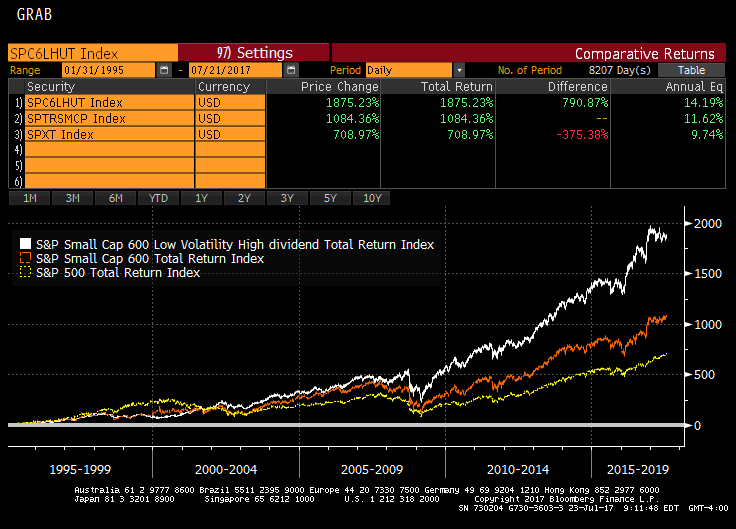
In backcasted index data back to early 1995, the S&P 600 High Dividend Low Volatility Index appears to show promise versus the broader S&P 600 and its large-cap cousin, the benchmark S&P 500.
How does this small-cap strategy generate this outperformance? As I showed in "Smart Beta Over Generations: Size," small caps have historically outperformed - with a notable exception. High-volatility small caps have historically generated negative returns. Volatility can be a way to screen for the potential for financial distress, and using volatility as a screen has kept this index away from stocks that pay high dividend yields simply because the market is questioning the future of the firm through a low share price relative to its dividend.
Despite this tremendous long-run performance, at this point, I do not believe the XSHD is investable. Given the very low assets under management, tracking error is elevated. Year to date, the fund has underperformed its index by 53 bp - a figure that is outsized relative to the 30 bp expense ratio. While the creation/redemption process in exchange-traded funds can offer investors another path towards liquidity, the creation unit size of 50,000 shares ($1.2 million) is likely too large for retail investors and about 15% of total AUM. Investors wishing to enter and exit the fund are likely to be met with wide bid/ask spreads given the low trading volumes.
In previous articles, I have examined two strategies that share some similarities with the underlying index for XSHD. The S&P SmallCap 600 Low Volatility Index (NYSEARCA:XSLV) focuses on the 120 lowest-volatility constituents of the S&P 600. The Russell 2000 Dividend Growers(NYSEARCA:SMDV) focuses on companies in the Russell 2000 (NYSEARCA:IWM) that have increased their dividends for at least 10 straight years.
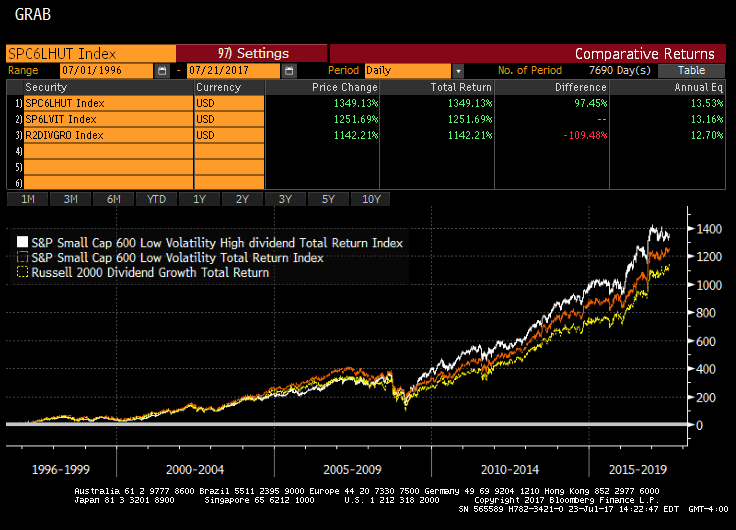
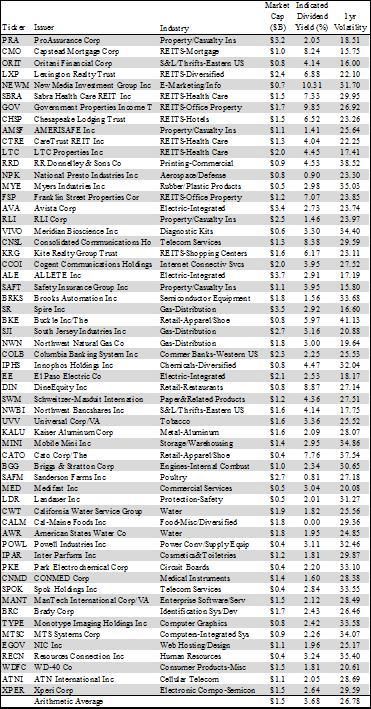
All three index strategies have delivered strong returns. For perspective, the S&P 500 generated only 8.37% annualized returns over that time span. I believe the S&P 600 Low Volatility High Dividend strategy has merit, but do not think there is an appropriate replicating vehicle at this point. For Seeking Alpha readers interested in further examining the underlying constituents of the strategy, I have tabled the current holdings of XSHD below. As one can see, the fund is currently heavily tilted towards REITs and Financials and materially underweight Energy.
I will continue to monitor XSHD as the fund matures. As it scales and becomes more liquid, it my be an interesting portfolio complement.
Disclaimer: My articles may contain statements and projections that are forward-looking in nature, and therefore inherently subject to numerous risks, uncertainties and assumptions. While my articles focus on generating long-term risk-adjusted returns, investment decisions necessarily involve the risk of loss of principal. Individual investor circumstances vary significantly, and information gleaned from my articles should be applied to your own unique investment situation, objectives, risk tolerance and investment horizon.
Disclosure: I am/we are long IJR, SMDV, XSLV, SPY, SPHD.
By Ploutus

Wednesday, July 12, 2017

Midstream Stock Yields 10.5%, With 40% Upside Potential, Insiders Are Buying


Image result for energy transfer partners

Summary

ETP is a midstream MLP which traded recently at $20.50 and yields 10.5%.
The stock has pulled back recently due to a complex merger and a distribution cut, creating shareholder morale issues.
ETP has strong growth projects coming online and could see massive DCF growth in the next two years.
The stock is currently seeing upgrades. Using analysts' ratings and price targets, ETP offers a 40% potential upside.
Based on our conservative assumptions, ETP share has at least 30% upside potential in addition to a growing yield which is likely to reach 15% by the year 2019.
This research report was jointly produced with High Dividend Opportunities co-author Philip Mause.
Energy Transfer Partners, L.P. (ETP), is an MLP (issuing K-1s) which has been declining in recent weeks. ETP traded recently at $20.50 and pays a distribution of $2.14 per year for a yield of 10.5%. ETP has just been through a somewhat confusing merger and an effective distribution cut which have created shareholder morale issues. ETP has multiple strong growth projects coming online and should see considerable growth in cash flow leading to higher distributions.
The Merger - ETP recently merged with Sunoco Logistics Partners (whose symbol was formerly SXL). We wrote about the merger in the following article: Merger Between SXL And ETP
Image result for Sunoco LogisticsAlthough ETP was by far the larger company, the merger was structured in an unusual manner. SXL actually acquired ETP by issuing one and a half shares of SXL for each ETP share. Then, SXL changed its name and its symbol to ETP. The overwhelming majority of shares in the new entity are shares exchanged for pre-existing ETP shares.
The big problem is that - prior to the merger - ETP unit holders were getting a dividend of more than $4 a unit. After the merger, an old ETP unit holder gets 1.5 units of the new ETP and receives only $3.21 in distributions. Thus, the merger effected a kind of "stealth" distribution cut. Less money is going out the door each quarter in distributions from the combined companies than was going out the door prior to the merger. And, we all know how much unit holders "love" distribution cuts.
The Business - ETP's business is best understood as consisting of five segments:
  1. Interstate Natural Gas Transmission - ETP owns and operates some of the most important interstate natural gas pipelines which serve as the backbone of the nation's energy infrastructure and transport natural gas from production areas to areas of high consumption. ETP's assets include Panhandle Eastern Pipeline, Florida Gas Transmission (50% ownership), and Transwestern Pipeline. All told, ETP has over 18,000 miles of interstate pipelines providing essential services to Florida, California, and the Upper Midwest.
  2. Intrastate Natural Gas Transmission - ETP has 8,300 miles of pipelines providing intrastate transmission services - largely in Texas. Because of the regulatory history of the industry, a large and distinct intrastate natural gas transmission industry emerged carrying gas from producing areas to chemical plants and other energy intensive users.
  3. Midstream - ETP has extensive midstream assets - primarily in the Permian, Marcellus, and Eagle Ford regions. It is engaged in a major buildout in the Permian region.
  4. Crude Oil - Although ETP has been primarily a natural gas oriented MLP, the recent merger added crude oil and refined product infrastructure assets. ETP has major crude oil pipelines serving the most active oil producing regions - including the Dakota Access Pipeline and the Permian Express. ETP has a large truck fleet and storage terminals with 32 million barrels of capacity. ETP provides fee based services and also purchases crude at the well-head for resale to the major oil companies and refineries.
  5. NGLs and Refined Products - ETP's activities in this area have grown with assets acquired through the merger. ETP has four fractionation plants strategically located to provide service in areas of heavy natural gas production. It also has major natural gas liquids pipelines and terminals. Its natural gas liquids storage facilities have capacity of nearly 60 million barrels. It also has refined products pipelines and terminals.
Growth Projects - ETP has major growth projects which are coming on line in 2017 and the next couple of years. These projects should increase EBITDA and Distributable Cash Flow ("DCF") substantially starting this year and running through 2019. This is the basis for the projections of increased EBITDA (set forth below) that were prepared in connection with the proxy materials associated with the merger. Expansion projects include the Dakota Access Pipeline. This vitally important pipeline will allow crude oil produced to be transported to refineries in the Gulf area. Readers will be aware that it has been subject to environmental opposition and that there is still an unresolved issue in the litigation. Although the pipeline has obtained government agency approval, private litigants continue to oppose it and are arguing that the environmental impact statement filed in connection with the project was inadequate in some respects and that the operations of the pipeline should be suspended pending a revision of the environmental impact statement. It is always hard to predict the outcome of litigation but, in this case, it would seem that the equities would balance in favor of permitting the pipeline to continue operations pending a revision, if necessary, of the environmental impact statement. The pipeline actually started service on June 1. It is such a major improvement in terms of cost and environmental protection in comparison with alternate means of transporting the oil that it will almost certainly achieve ultimate approval although, as noted above, it is possible that a suspension of operations will be ordered, and, as long as the litigation is pending, there will be somewhat of a cloud over the project.
Other growth projects include:
  1. The Rover Pipeline (scheduled to come on line in July 2017),
  2. The Panther Processing Plant (January 2017),
  3. The Arrowhead Processing Plant (Q3, 2017),
  4. The Comanche Trail and Trans-Pecos (Q1, 2017),
  5. The Mariner East 2 (Q3, 2017),
  6. The Revolution System (pipelines and processing plants) (Q4, 2017),
  7. The Bayou Bridge (Q4, 2017).
These projects are targeted at areas of increased drilling and should all increase ETP's financial performance as we move forward.
Q1 2017 - For Q1, 2017, ETP has prepared a pro-forma financial report setting forth results for the combined company:
  • Adjusted EBITDA came to $1.414 billion, and DCF came in at $907 million - with a unit count of 1.084 billion common units.
  • ETP distributions totaled $582 million to common units and some $220 million to IDRs.
  • If we annualize these numbers, assume no growth, and give common units $50 million credit for the undistributed DCF (the difference between the $907 million in DCF and the $802 million actually distributed to common unit holders and IDRs), we get quarterly DCF of $635 million available to common units and an annual total of roughly $2.540 billion or $2.34 per unit.
  • This would imply a Price/DCF ratio of 8.7 times. This is a reasonable price level for a large, well diversified MLP. Unfortunately, the analysis is not so simple due to complexities associated with the IDRs.
The IDR/Relinquishment Issue - Based on recent SEC filings (dated 3/24/2017) the new, merged entity will also have a somewhat complex IDR situation. IDRs kick in at low distribution levels with IDRs set at:
  • 13.39% of distributions over 8.33 cents per quarter;
  • 35.39% of distributions over 9.58 cents per quarter;
  • and 48.33% of distributions over 26.38 cents per quarter.
Distributions are now set at 53.5 cents per quarter. With unit count at 1.084 billion, IDRs would normally have been $377 million for Q1 2017. This would have resulted in total distributions to IDRs and common units of $959 million - considerably more than Q1 2017 DCF of $907 million.
To help solve this problem, the manager - Energy Transfer Equity, L.P.(ETE) - has a "relinquishment" program in effect under which $655.5 million, $153 million, and $128 million in earned IDRs will be relinquished (simply not taken), respectively, for the years 2017, 2018, and 2019. After 2019, there will be a perpetual relinquishment of $33 million per year. Thus, in the past quarter, the new ETP generated some $907 million in DCF and distributed $582 million to unit holders. It would normally have been required to distribute $377 million in IDRs which would have meant that distributions of $959 million would have exceeded DCF. But the relinquishment program reduced IDR distributions by $157 million with the result that total distributions came to $802 million. ETP proudly announced that it had a distribution coverage level of 1.13. Of course, without relinquishment, the distributions would not have been covered at all. Thus, without any growth whatsoever, ETP would likely have to cut distributions sometime in 2018 after the generous 2017 relinquishment levels are replaced by much lower levels of IDR relinquishment. This is because the cost of paying IDR's will increase once the level of IDR relinquishment is substantially reduced (and thus the amount actually paid out in IDRs increases). An investor may reasonably ask - how can distributions increase once IDR relinquishment decreases? The answer is simple: ETP is clearly planning for substantial DCF growth. In fact, its management asserts that it should be able to generate double-digit distribution growth over the next two years.
Growth Projections - ETP is planning for substantial growth in cash flow and has numerous large projects coming online this year and next. ETP is projecting that it will be able to have low double-digit increases in distributions for the next couple of years. This will require very large cash flow increases from these new projects. While ETP has not issued guidance in this regard, it has published projections in its proxy statement (available on its corporate webpage) in connection with voting on the merger. These projections purport to show future results of each of the two merged companies if they were to continue as independent entities. They also include projections of EBITDA for the merged company used by Barclays which was retained in connection with the merger (Barclays report is described in an SEC filing dated 3/24/17 - a proxy statement - at page 92). We have calculated DCF for the merged company by subtracting $2 billion a year to account for interest payments and maintenance capital expenditures. This $2 billion per year estimate is based upon an annualization of the amount by which EBITDA exceeded DCF in the first quarter of 2017 - which was roughly $500 million. When we subtract this $2 billion from each year's EBITDA estimate for the merged companies, we derive an estimate of the annual DCF for the merged companies. The tables below show projections for each of the original companies as standalone entities and a projection for the merged entity. All numbers are in billions of dollars.
Investors should be aware, however, that these projections cannot be taken to the bank and spent today. They assume, for example, that the oil price will be $50 in 2017, $55 in 2018, and $60 in 2019. While ETP is not directly exposed to the oil price the way oil companies are, volumes on its pipelines would be affected by the level of drilling in the United States which would, in turn, be affected by the oil price. The projections also assume a constant unit count of roughly 1.1 billion common units. In addition, the DCF projection for the merged companies is not from Barclays but instead uses the EBITDA projection used by Barclays and then assumes that interest plus maintenance capital expenditures will continue to equal the roughly $500 million per quarter experienced in the first quarter of 2017. It is entirely possible that this offset will increase due to higher interest rates, increased debt due to capital expenditures, and increased maintenance capital expenditures due to additional facilities. For all of these reasons, we have made some conservative assumptions to arrive at a valuation. If the newly merged ETP can hit these numbers (or anything reasonably close to them), this stock will be a huge winner. Management is projecting double-digit distribution increases in the "near term".

Bill Gates’ Portfolio: 5 Dividend Stocks Held By The World’s Richest Man

Image result for bill gates


Billionaire Bill Gates is the world’s richest man, with a net worth of $86 billion, as estimated by Forbes. After having co-founded Microsoft Corporation (NASDAQ:MSFT), which later became the world’s largest software company, Bill Gates has considerably expanded his fortune not only through ownership of Microsoft stock, but also through investing. Bill Gates doesn’t reveal his portfolio of investments, but we can get an idea about his holdings by looking at the 13D and 13G filings of his investment arm, Cascade Investment, as well as by looking at the 13F filings reported by his charity, the Bill & Melinda Gates Foundation Trust.
When it comes to billionaires, we mere mortals always want to take a peek and get a glimpse into their lives, lifestyles, and routines that helped them develop the skills and discipline that led to their success and wealth. To that end, be sure to check out our list of 20 surprising facts about Bill Gates’ House.
When it comes to investing, a fact that is often overlooked is that Bill Gates is not solely responsible for his portfolio. In fact, he only takes care of his investments in technology and biotech, which are not even held by Cascade Investment, so little-to-nothing is known about them. The bulk of Bill Gates’ portfolio is handled by Michael Larson, who also manages the Bill & Melinda Gates Foundation Trust. Larson is responsible for Gates’ investments in property and non-technology stocks and has been running Cascade since 1994. Due to the secretive nature of the asset management firm (Cascade does not label itself as a family office), we can only get a slight idea about its returns from various articles in the media. Between 1995 and 2015, Cascade has reportedly had a compound annual return of 11%, while during the financial crisis, its losses were smaller than those of the broader market.
At Insider Monkey, we follow hundreds of investors like the Bill & Melinda Gates Foundation Trust. By analyzing their filings with the Securities and Exchange Commission, we can identify the stocks that these investors are collectively bullish on. We then share those stocks with our premium subscribersas part of our flagship strategy, which has returned over 44% since February 2016.
Even though there is not much information about Larson’s investment principles, judging by the publicly disclosed filings, he has a rather conservative approach and prefers to hold positions in a relatively small number of stocks for long periods of time. According to the 13F filings of the Bill & Melinda Gates Foundation Trust, out of 18 positions held at the end of March, more than half have been included in the Trust’s portfolio for over a decade. It’s also worth mentioning that several of the Trust’s long-term holdings have solid dividend yields.
With this in mind, let’s take a look at five dividend stocks that are held by Bill Gates via the Bill & Melinda Gates Foundation Trust, beginning on the next page.

5. Waste Management, Inc. (NYSE:WM)

Image result for Waste Management, Inc.Let’s start with Waste Management, Inc. (NYSE:WM), which is the second-largest holding in the Bill & Melinda Gates Foundation Trust’s equity portfolio as of the end of March. The fund disclosed holding 18.63 million shares of the company worth $1.36 billion. It should also be mentioned that Waste Management, Inc. (NYSE:WM) is one of the oldest investments held by the Trust, having been included in its equity portfolio since 2002. The stock has gained over 200% since then. The company pays a dividend of $0.43 per share, which gives its stock a yield of 2.30%.
Because Waste Management, Inc. (NYSE:WM) is the largest waste and recycling company in North America, it has been able to consistently generate cash flow, which in turn has allowed it to increase its dividends consistently for the last 14 years. Waste Management, Inc. (NYSE:WM) is also well positioned to be a cash flow-generating machine over the long-term, as it owns 240 landfills and a large network of recycling facilities. Even though its landfill business might decline as consumers become more aware of environmental issues and reduce their waste, its big recycling business helps offset some of the risks. Including Bill Gates’ Trust, there are 29 funds in our database holding shares of Waste Management, Inc. (NYSE:WM) as of the end of March, down by seven funds over the quarter.

4. Wal-Mart Stores Inc (NYSE:WMT)

Image result for walmartThen there is Wal-Mart Stores Inc (NYSE:WMT), in which the Bill & Melinda Gates Foundation Trust owns 11.60 million shares worth $836.34 million. Wal-Mart Stores Inc (NYSE:WMT) is the only dividend aristocrat in which the Trust is invested and the stock currently has a yield of 2.70%. Wal-Mart Stores Inc (NYSE:WMT) has a tough battle ahead of it as it tries to take on Amazon.com, Inc. (NASDAQ:AMZN) in the online retail space. While still a leader in terms of overall sales, having generated $482 billion last year, versus Amazon’s $136 billion, Wal-Mart will have to adopt changes as the online retail industry expands to include groceries, a development that seems imminent now that Amazon has bought Whole Foods.
However, the good news is that Wal-Mart Stores Inc (NYSE:WMT) has the infrastructure required to perform well, as it has over 5,000 locations in the U.S, including over 3,000 Supercentres. Moreover, their close proximity to residential customers means that Wal-Mart can easily provide same-day delivery to its customers. In any case, the U.S retail market is worth over $5.0 trillion, so there’s plenty of room for both Wal-Mart and Amazon. Overall, 48 funds tracked by Insider Monkey disclosed long positions in Wal-Mart Stores Inc (NYSE:WMT) in the latest round of 13F filings, compared to 54 funds a quarter earlier.

3. Caterpillar Inc. (NYSE:CAT)

Caterpillar Inc. (NYSE:CAT), which has a dividend yield of 2.90%, is represented in the Bill & Melinda Gates Foundation Trust’s equity portfolio by a $1.04 billion stake containing 11.26 million shares. The stake makes the fund Caterpillar Inc. (NYSE:CAT)’s largest shareholder among the 38 funds in our database that are bullish on the stock as of the end of March.
The Trust has held shares of the mining and construction equipment maker since 2005, during which time the stock has more than doubled in value. Caterpillar Inc. (NYSE:CAT) has also more than tripled its dividend during that time, to $0.78 from $0.25 per share. In its latest financial report, Caterpillar Inc. (NYSE:CAT) delivered EPS of $1.28 in the first quarter, which was significantly above the consensus estimate of $0.62. In addition, its revenue of $9.82 billion was $550 million higher than expected and also rose by 3.8% on the year, which was its first quarterly revenue growth since 2014.

2. United Parcel Service, Inc. (NYSE:UPS)

Image result for UPS
In United Parcel Service, Inc. (NYSE:UPS), the Bill & Melinda Gates Foundation Trust disclosed a $485.57 million stake that contained 4.53 million shares as of March 31. Overall, the company registered a decline in popularity among the funds we track, as the number of investors long the stock fell to 36 from 41 between January and March. In 2017, United Parcel Service, Inc. (NYSE:UPS) increased its dividend to $0.83 from $0.78, which provides its stock with a yield of almost 3%.
United Parcel Service, Inc. (NYSE:UPS) is among the best stocks to invest in for the long-term. It operates in an industry dominated by a few well-established companies like FedEx Corporation (NYSE:FDX) and is unlikely to face a lot of competition because of high barriers to entry. Providing delivery services requires a large fleet of trucks, planes, and cargo ships and a large network of warehouses and outlet locations, all of which are capital intensive.
There are concerns that Amazon.com, Inc. (NASDAQ:AMZN) might undercut delivery companies like United Parcel Service, Inc. (NYSE:UPS) because the eCommerce giant has been building its own fleet of planes and trucks. However, while delivery companies will be affected if Amazon takes delivery into its own hands, the online retail business is very large and continuously growing and traditional retailers seeking to expand their online presence will require companies like United Parcel Service, Inc. (NYSE:UPS) to handle deliveries.

1. Crown Castle International Corp. (REIT) (NYSE:CCI)

Finally, the stock with the highest dividend yield in the Bill & Melinda Gates Foundation Trust’s 13F portfolio is Crown Castle International Corp. (REIT) (NYSE:CCI), which has a yield of 3.75%. At the end of March, the Michael Larson-managed fund owned 5.33 million shares of the REIT, worth $503.69 million.
Wireless Towers Commscope COMM American Tower AMTAs people are using their phones ever more frequently and companies like Facebook Inc (NASDAQ:FB) and Alphabet Inc (NASDAQ:GOOGL) are investing more in the development of their mobile platforms, the demand for mobile data and mobile network infrastructure will grow and Crown Castle International Corp. (REIT) (NYSE:CCI) stands to benefit a lot from this trend. Crown Castle International Corp. (REIT) (NYSE:CCI), which has a market cap of $37 billion, currently owns around 40,000 cell towers, and thanks to that size, it can afford to invest further in its infrastructure. Including the Trust, 38 funds from our database held shares of Crown Castle International Corp. (REIT) (NYSE:CCI) at the end of the first quarter, compared to 36 funds at the end of 2016.
By Alexandr Oleinic