Showing posts with label Bank Of America. Show all posts

Friday, March 3, 2017

Bank Of America: Here's How The Bullish Channel Might Play Out


Image result for bank of america images

 About: Bank of America Corporation (BAC)Includes: KBEXLF

Summary

Bank of America is trading in a bullish channel that puts resistance at $27 (mid-term) and $28.50 for the top of the channel.
Bank of America has broken its 7.5% range set in January and has traveled nearly the distance in that range (the $25 to $26) zone.
Since BAC is moving on momentum, monitoring momentum indicators will be key going forward to ensure higher prices match higher momentum levels.
Thanks to President Trump, we've seen a bump in stocks once again. Bank stocks like those listed in the SPDR S&P Bank ETF (NYSEARCA:KBE) and the Financial Select Sector SPDR ETF (NYSEARCA:XLF) are rallying and of course a big winner is Bank of America Corporation (NYSE:BAC).
With these rapid and unprecedented gains, it's important to have a risk management strategy in case the market turns.
In full disclosure, this analysis is not a recommendation to buy or sell at a specific level. I'm not a financial advisor. My goal is to help you identify areas of risk in your portfolio, identify areas of resistance and support, and areas where volatility is likely to rise.
If you receive me articles via email as a follower on Seeking Alpha, you'll know on January 24th, we discussed the resistance area of $25 to $26 upon a break of the 7.5% range that BAC was stuck in at that time. I'm not going to rehash the article, but I'd like to show how momentum stayed strong throughout this move higher.
Here' the chart below and three key points from the January article:
  • If BAC stock breaks out of the current 7.5% range, this range-break can sometimes, (not always) propel the stock to travel the length of the range.
  • As a result, a range-break could translate to a 7.5% move higher to the $25 area.
  • A higher move in RSI could correspond to BAC price break to the $25 price target.
The Relative Strength Index (RSI) is a momentum indicator and an overbought-oversold indicator.
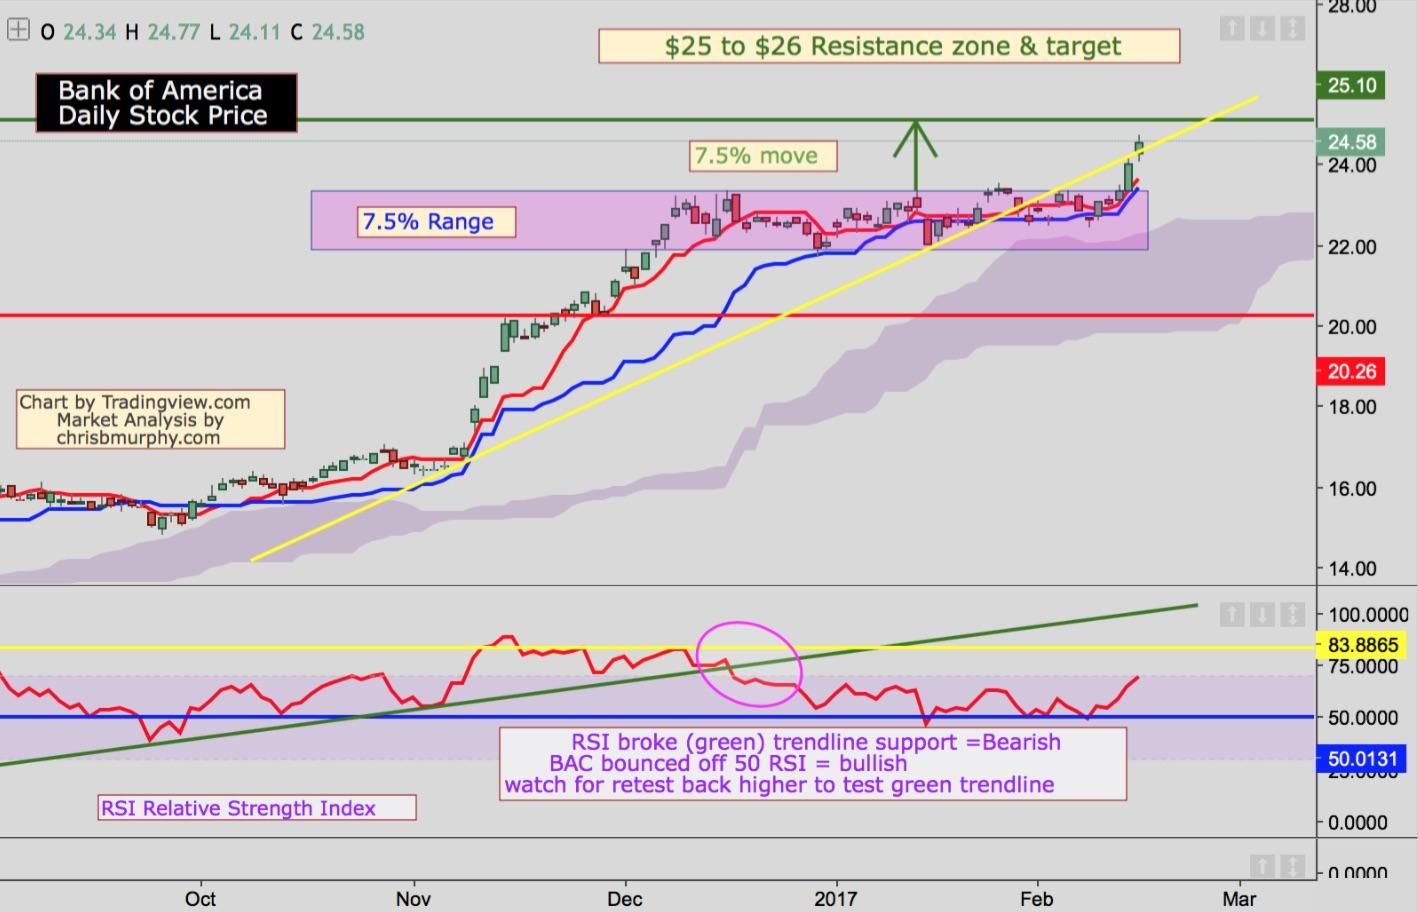
In the chart above (from January), the bounce off the 50 level is a bullish signal.
Typically, in a bull-run, we want to see RSI above 50 for a strong move higher. If it breaks below 50, we typically get a pullback. However, if RSI breaks below 40, we tend to see a more significant correction.
Updated Daily Chart Bank of America:
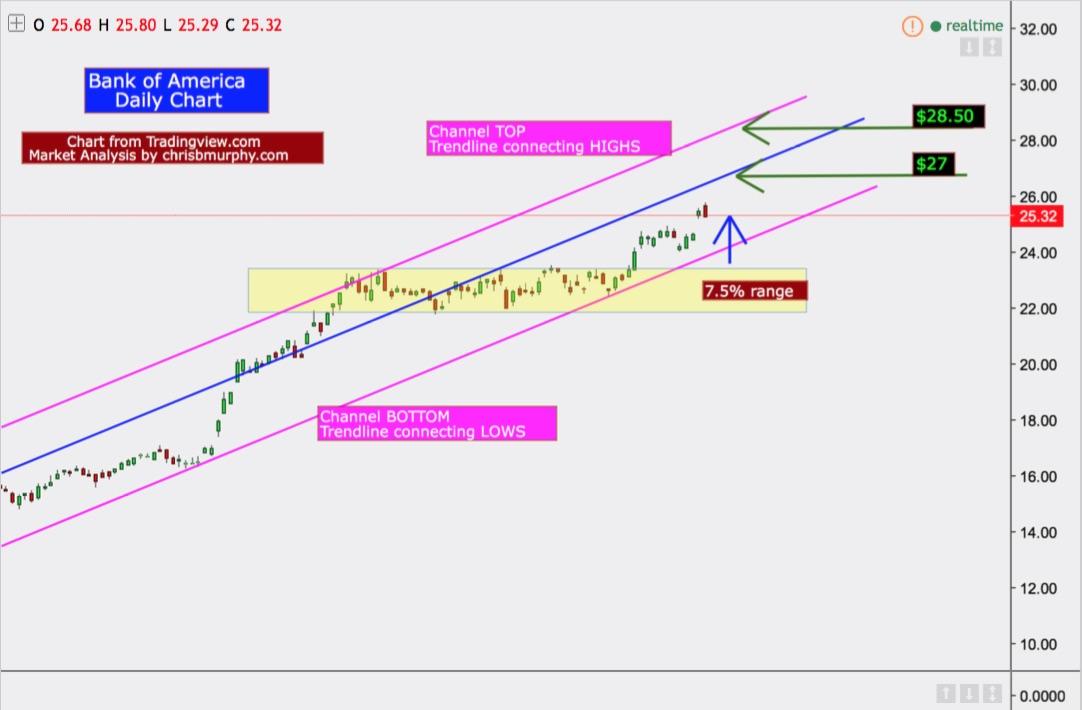
  • We can see the breakout out of the 7.5% range (at the moment) stalling a little $25.50 level of resistance.
  • The pink trendlines represent the bullish channel BAC is currently trading within; the bottom pink line connects the lows and the top pink line connects the highs of the move.
How I drew the line: I took the trendline from the lows, and "cloned" it (so to create the exact-same angle). Next, I moved the newly cloned pink line to the top of the price action to create the top pink trendline. By having both pink lines at the same angle, it gives us a more accurate picture of the top and bottom of the bullish channel.
  • The blue line (also cloned from the bottom trendline) represents a near-term resistance of the $27 area.
  • The channel top (pink trendline) comes in around $28.50 (at the time of this writing).
At both the blue and pink trendlines ($27 to $28.50), BAC could see an increase in volatility and stops (take-profit orders) and it's important investors have a risk-management strategy as we approach these levels.
Matching RSI Momentum with Price Action:
When I worked on a trading desk a few years back, one of the best pieces of advice I received from a successful FX trader was "always look to the left on a chart."
In other words, as price or momentum moves higher or lower, watch to see if the current levels are passing the prior levels to the left. If the current levels are not passing levels to the left, resistance is likely to follow, perhaps a pullback, or maybe price might need a few attempts to pass the levels on the left.
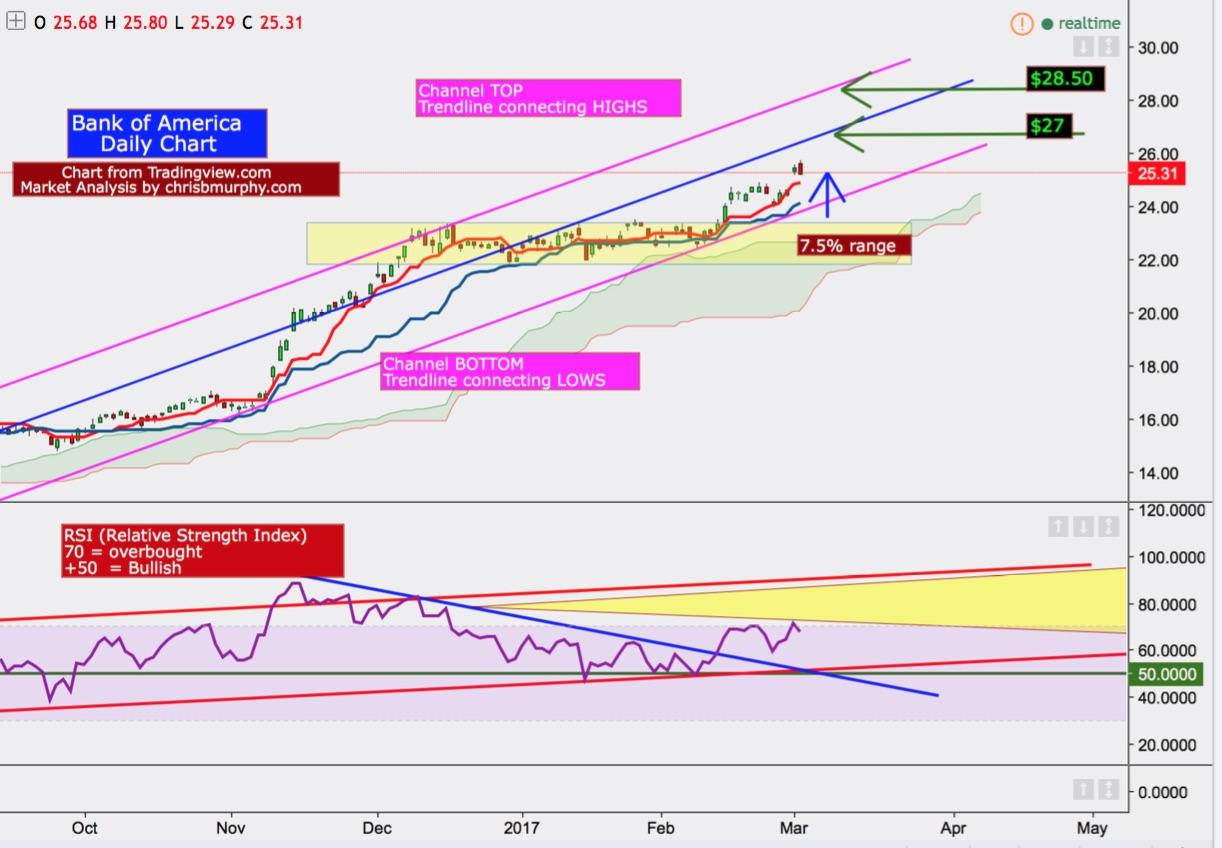
  • With RSI, we can see momentum broke the blue trendline connecting the RSI highs in momentum (bullish sign).
  • Also, we bounced off the 50 line (green line) as we highlighted the necessity in the January article.
What to watch for:
  • Be sure to match momentum with price so that RSI makes higher highs while BAC makes higher highs.
  • As a result, we want to watch to see RSI move higher and trade into the yellow zone, (passes the prior highs in January & February).

Tuesday, February 14, 2017

Bank of America Begins Its Next Powerful Move Higher


Bank of America is one of the top performing stocks in Tuesday's powerful move in the financial sector.


A Bank of America branch

Bank of America  (BAC) is breaking out of a 10-week consolidation Tuesday. The stock is up just shy of 3% and is beginning to put some distance on a very heavy resistance zone near $23.50. As Bank of America builds on Tuesday's momentum, a major support zone is being left behind. With a base this solid underneath, the stock is set up well for more upside.

Bank of America first reached the $23.50 area back in early December as the initial phase of the post-election rally began to run out of steam. After surging more than 35% from its Nov. 8 low, the stock was in need of a healthy rest. Over the last 10 weeks, that's exactly what Bank of America got. The stock moved sideways during this phase while its extremely overbought MACD (moving average convergence/divergence) indicator returned to neutral. Another positive was Bank of America's ability to maintain its string of higher monthly lows. As we enter mid February, the stock is tracing out its 8th straight one. Certainly a very bullish set up, and a strong indication of more upside ahead.
In the near term, Bank of America investors should take on a more positive view of the pattern. The stock now has a major support zone developing that runs from the $24.00 to $23.00 area. It would take a close back below the $22.40 area to derail Tuesday's breakout. On the upside, Bank of America has plenty of room to run. A fresh rally leg could carry shares all the way up to the $26.50 area without running into significant resistance. This key level marks the stock's 10-month moving average. Bank of America has been trading below this long-term indicator since October of 2008. It would take another 10% of upside from current levels for this area to be reached. Profit taking here, at least partial, would be wise.
Click here to see enlarged chart in a new window.

By Gary Morrow

Source: https://www.thestreet.com/story/14002007/1/bank-of-america-begins-fresh-rally-leg.html

Sunday, December 11, 2016

Bull of the Day: Bank Of America (BAC)


Image result for bank of america

Bank of America (BAC Free Report) is on some kind of unbelievable run. The stock is up about 35% over the last month and investors are bidding it up looking for more! Let's take a look at the fundamentals of this stock and explore why it is a Zacks Rank #1 (Strong Buy) and the Bull of the Day.
Why I Like It
A good earnings history when compared to the Zacks Consensus Estimate.This is a large-cap stock is a market leader.
Higher interest rate environment is good for the banks
The stock has seen a big "Trump Bump" now if the economy gets one too this stock will continue to move higher.
Follow Brian Bolan on twitter at @BBolan1 and on StockTwits at the same address.
The Recent Numbers
I like to do a review of the most recent quarter for stocks that I highlight as Bulls of the Day. BAC reported the September 2016 quarter back in mid October.
The most recent quarter was a beat on top and bottom. The company posted EPS of $0.41 when the Zacks Consensus Estimate was calling for $0.34. That translates into a positive earnings surprise of 20.6%.
Revenue came in $836M ahead of expectations for a 4% positive revenue surprise. As a result, the stock was bid up by more than 1.6% in the session following the report.
Description
Bank of America is a financial services company. Bank of America Corp was founded in 1874 and is based in Charlotte, North Carolina.
Earnings History
The company has a strong history of beating the Zacks Consensus Estimate. There has only been one miss in the last six reports. The rest of the reports were all beats.
The chart above show the beats and misses for BAC over the last several years. I see only one miss per year in each of the last three years.
Estimates
The estimate picture looks really good, with the Zacks Consensus Estimate for 2016 moving from $1.27 in September to $1.47 in October.
The 2017 number moved from $1.55 in September to the current level of $1.61.
That same chart from above show the earnings estimates moving higher for 2016 and 2017. This is just what investors want to see.
One More Chart
Let's take a look at one the great features of the Zacks website, you can find this function for every stock on the "Financial Overview" section. You can chart all sorts of things against, well all sorts of things but I like to chart them against the stock price.
For BAC, and any bank, it is helpful to think about the ROA and how the stock has traded with the quarterly movement in that measure.
To me, a higher interest rate environment will likely boost ROA and the stock seems to follow that trend.

Wednesday, November 30, 2016

The ‘Great Rotation’ has begun, but you might be looking at the wrong market: Morgan Stanley

The ‘Great Rotation’ has begun, but you might be looking at the wrong market: Morgan Stanley
Tim Boyle | Bloomberg | Getty Images. The advice for 2017 is clear: sell credit to buy equities – the opposite advice of a year ago, Morgan Stanley said in its latest global strategy outlook.
The advice for 2017 is clear: sell credit to buy equities – the opposite advice of a year ago, Morgan Stanley (NYSE: MS) said in its latest global strategy outlook.
The investment advice indicates that the " Great Rotation " – the idea of shifting from bonds to stocks coined by Bank of America Merrill Lynch five years ago – is taking place. However, Morgan Stanley believes that the best equities are not in the U.S., as most investors seem to be favouring.
"I think this is also the time where you have maximum confidence in U.S. policy making. This is the moment where everything is possible and you can dream the Trump administration will do everything that markets like and none of the things that market won't like. And that is possible until the administration starts," Andrew Sheets, chief cross-asset strategist at Morgan Stanley, told journalists on Monday.
Expectations of higher inflation and of a shift towards fiscal expansion on the back of Trump's election pushed the Dow to record highs .
In the first week after Trump's election investors poured $28 billion into equities, the biggest inflows seen in two years, and bonds witnessed the biggest outflow in three and a half years of $18 billion, according to data from Bank of America Merrill Lynch.
But Morgan Stanley believes the market is "too optimistic". The investment bank forecasts higher global yields and dollar in the first quarter of next year and a tightening in financial conditions. The more upbeat markets are that the next U.S. administration will be market-friendly, the more likely it is that it will be disappointed, the bank states.
For example, confidence on further infrastructure investments could dissipate once projects are revealed, the bank said.
However, instead of looking at U.S. equities, Morgan Stanley believes both Japanese and European shares can offer higher returns.
"Europe is really easy to dislike and I actually think it works in its advantage," Sheets said.
"The political risk in Europe is there but it's well flagged," he added.
Silvia Amaro

Monday, December 29, 2014

Why Bank Of America Should Trade For $22 In 2015

Summary
  • BAC's terrific balance sheet has positioned the company well for higher credit demand.
  • Rising interest rates should bolster returns from the portfolio.
  • A conservative multiple on BAC's rising earnings - if I'm right - would mean $22 is very possible in 12 months' time.
I've written extensively here on SA about my bullishness for Bank of America (NYSE:BAC), a stock that I think still has some legs despite its huge move up recently. The stock has been a battleground for investors to say the least as the company has had several multi-billion dollar legal headaches that have sucked investors dry over the past few years. Whether all of the penalties were deserved or not is really moot at this point because the fact is the money has been paid (or reserved) and it's done. But that means investors can move ahead and value BAC like a bank instead of valuing it based on the whims of the Justice Department's next suit against it. I called for BAC to hit $20 in 2015 a few months ago on the back of the company being on track to earn $1.75 in 2015 and in this article, I'll take a look at those predictions and assess BAC's value after rallying to $18 late in 2014.
(click to enlarge)
To do this, I'll use a DCF-type model you can read more about here. The model includes inputs such as earnings estimates, sourced from Yahoo!, dividends, which I've set to grow at 10 cents next year and 20 cents per year after, and a discount rate, which I've set at the 10 year Treasury rate plus a risk premium of 5.75%.
2014
2015
2016
2017
2018
2019
Earnings Forecast
Prior Year earnings per share
$0.90
$0.44
$1.47
$1.59
$1.72
$1.85
x(1+Forecasted earnings growth)
-51.10%
234.10%
8.00%
8.00%
8.00%
8.00%
=Forecasted earnings per share
$0.44
$1.47
$1.59
$1.72
$1.85
$2.00
Equity Book Value Forecasts
Equity book value at beginning of year
$26.45
$26.69
$27.86
$28.95
$29.96
$30.92
Earnings per share
$0.44
$1.47
$1.59
$1.72
$1.85
$2.00
-Dividends per share
$0.20
$0.30
$0.50
$0.70
$0.90
$1.10
=Equity book value at EOY
$26.45
$26.69
$27.86
$28.95
$29.96
$30.92
$31.82
Abnormal earnings
Equity book value at begin of year
$26.45
$26.69
$27.86
$28.95
$29.96
$30.92
x Equity cost of capital
8.00%
8.00%
8.00%
8.00%
8.00%
8.00%
8.00%
=Normal earnings
$2.12
$2.14
$2.23
$2.32
$2.40
$2.47
Forecasted EPS
$0.44
$1.47
$1.59
$1.72
$1.85
$2.00
-Normal earnings
$2.12
$2.14
$2.23
$2.32
$2.40
$2.47
=Abnormal earnings
-$1.68
-$0.66
-$0.64
-$0.60
-$0.54
-$0.47
Valuation
Future abnormal earnings
-$1.68
-$0.66
-$0.64
-$0.60
-$0.54
-$0.47
x discount factor(0.08)
0.926
0.857
0.794
0.735
0.681
0.630
=Abnormal earnings disc to present
-$1.55
-$0.57
-$0.51
-$0.44
-$0.37
-$0.30
Abnormal earnings in year +6
-$0.47
Assumed long-term growth rate
3.00%
Value of terminal year
-$9.46
Estimated share price
Sum of discounted AE over horizon
-$3.44
+PV of terminal year AE
-$5.96
=PV of all AE
-$9.40
+Current equity book value
$26.45
=Estimated current share price
$17.05
We can see the model produced a fair value of $17, one dollar below where shares are currently trading. That means the model is saying BAC is more than fairly valued and should probably be sold. But what does the model do? The intention is to provide investors with a price at which a margin of safety can be achieved; with BAC trading over the fair value price no margin of safety is implied. But the model is currently using analyst consensus estimates and I believe those estimates are too conservative.
My bullishness on BAC has always been predicated on the company being able to return to 'normal' levels of earnings on its ample asset base. BAC has been an interesting study in the past decade or so in a bank that went from being just a bank to one that attempted to become a financial services juggernaut, only to be humbled by the financial crisis, terrible decisions and expensive acquisitions. The thing that has become clear about the last few years with Bank of America is that it is not simply a bank; it is a full service money center bank that attempts to touch consumers at every point of their financial lives. This sounds great in theory but poor management from prior regimes has left BAC with a tangled web of huge losses and a bad reputation, a condition that has been getting better with time.