
About: Bank of America Corporation (BAC), Includes: KBE, XLF
Summary
Bank of America is trading in a bullish channel that puts resistance at $27 (mid-term) and $28.50 for the top of the channel.
Bank of America has broken its 7.5% range set in January and has traveled nearly the distance in that range (the $25 to $26) zone.
Since BAC is moving on momentum, monitoring momentum indicators will be key going forward to ensure higher prices match higher momentum levels.
Thanks to President Trump, we've seen a bump in stocks once again. Bank stocks like those listed in the SPDR S&P Bank ETF (NYSEARCA:KBE) and the Financial Select Sector SPDR ETF (NYSEARCA:XLF) are rallying and of course a big winner is Bank of America Corporation (NYSE:BAC).
With these rapid and unprecedented gains, it's important to have a risk management strategy in case the market turns.
In full disclosure, this analysis is not a recommendation to buy or sell at a specific level. I'm not a financial advisor. My goal is to help you identify areas of risk in your portfolio, identify areas of resistance and support, and areas where volatility is likely to rise.
If you receive me articles via email as a follower on Seeking Alpha, you'll know on January 24th, we discussed the resistance area of $25 to $26 upon a break of the 7.5% range that BAC was stuck in at that time. I'm not going to rehash the article, but I'd like to show how momentum stayed strong throughout this move higher.
Here' the chart below and three key points from the January article:
- If BAC stock breaks out of the current 7.5% range, this range-break can sometimes, (not always) propel the stock to travel the length of the range.
- As a result, a range-break could translate to a 7.5% move higher to the $25 area.
- A higher move in RSI could correspond to BAC price break to the $25 price target.
The Relative Strength Index (RSI) is a momentum indicator and an overbought-oversold indicator.
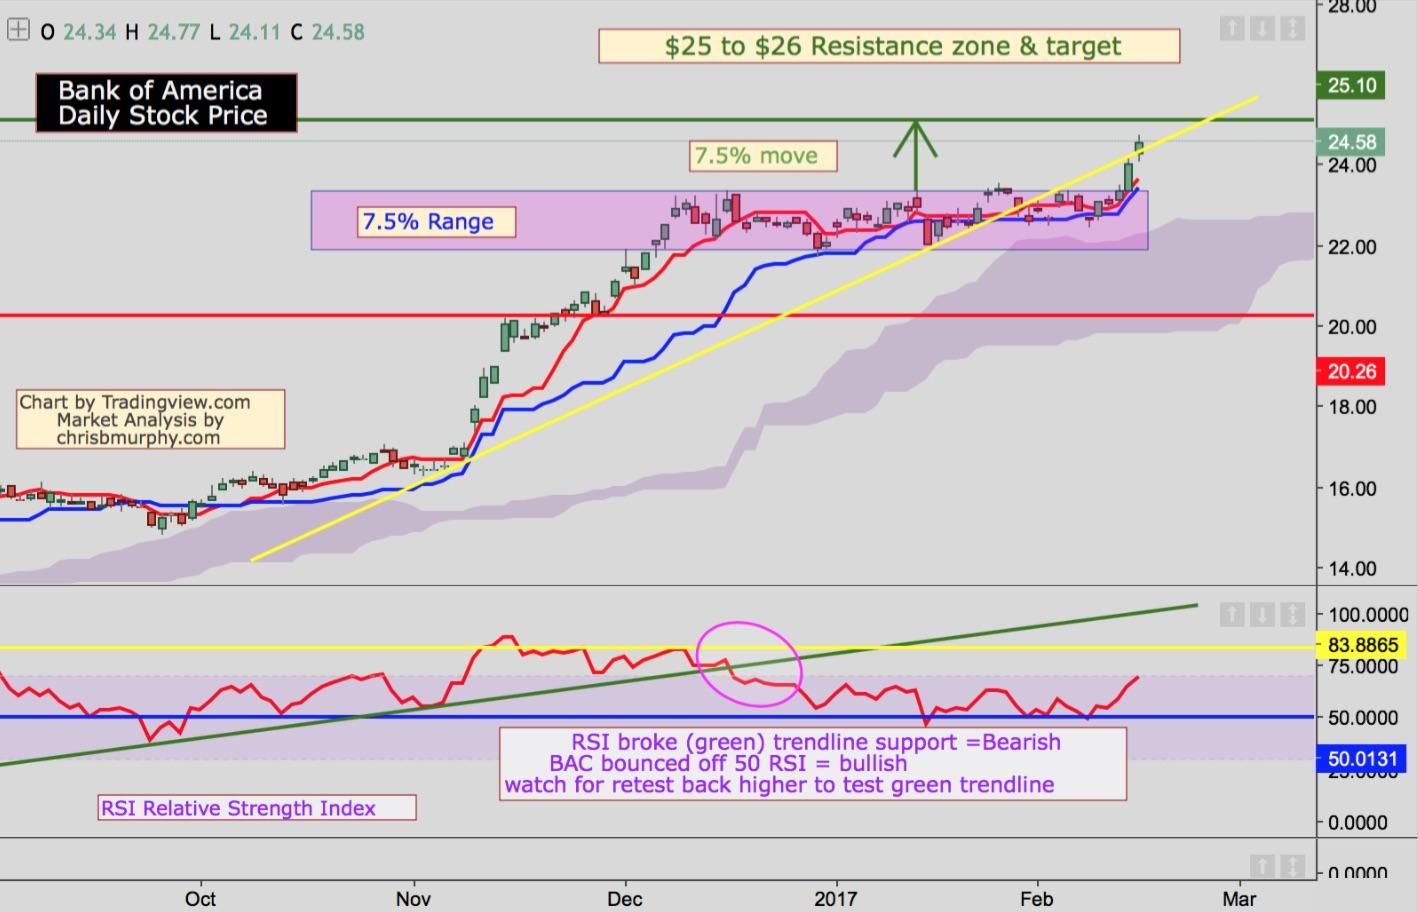
In the chart above (from January), the bounce off the 50 level is a bullish signal.
Typically, in a bull-run, we want to see RSI above 50 for a strong move higher. If it breaks below 50, we typically get a pullback. However, if RSI breaks below 40, we tend to see a more significant correction.
Updated Daily Chart Bank of America:
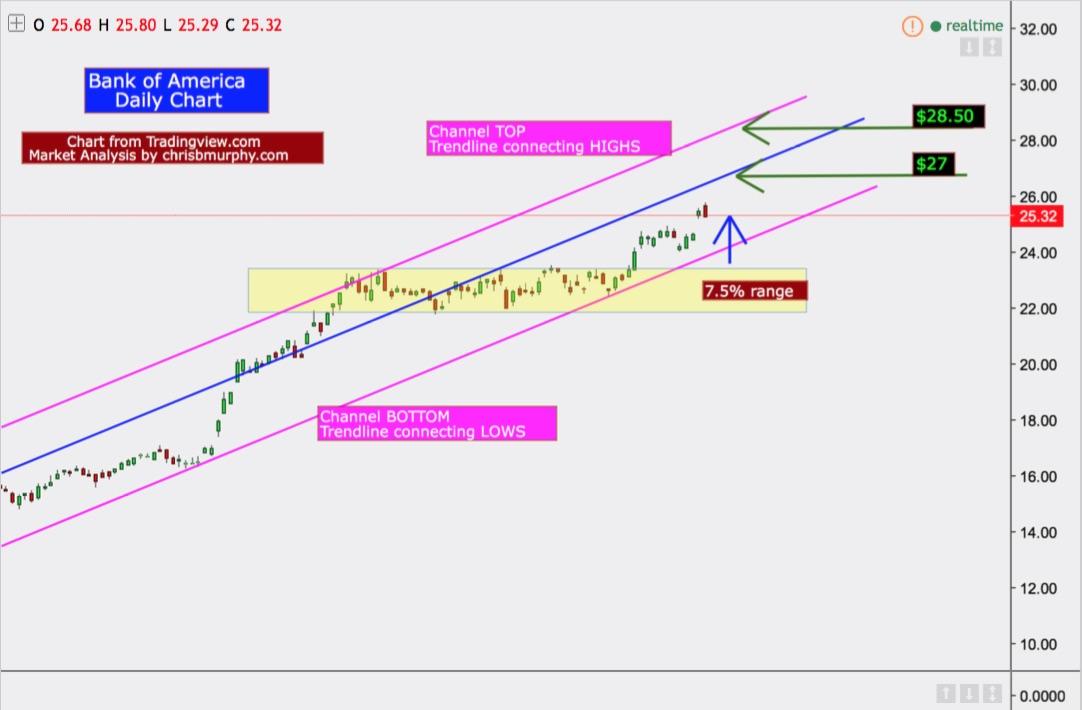
- We can see the breakout out of the 7.5% range (at the moment) stalling a little $25.50 level of resistance.
- The pink trendlines represent the bullish channel BAC is currently trading within; the bottom pink line connects the lows and the top pink line connects the highs of the move.
How I drew the line: I took the trendline from the lows, and "cloned" it (so to create the exact-same angle). Next, I moved the newly cloned pink line to the top of the price action to create the top pink trendline. By having both pink lines at the same angle, it gives us a more accurate picture of the top and bottom of the bullish channel.
- The blue line (also cloned from the bottom trendline) represents a near-term resistance of the $27 area.
- The channel top (pink trendline) comes in around $28.50 (at the time of this writing).
At both the blue and pink trendlines ($27 to $28.50), BAC could see an increase in volatility and stops (take-profit orders) and it's important investors have a risk-management strategy as we approach these levels.
Matching RSI Momentum with Price Action:
When I worked on a trading desk a few years back, one of the best pieces of advice I received from a successful FX trader was "always look to the left on a chart."
In other words, as price or momentum moves higher or lower, watch to see if the current levels are passing the prior levels to the left. If the current levels are not passing levels to the left, resistance is likely to follow, perhaps a pullback, or maybe price might need a few attempts to pass the levels on the left.
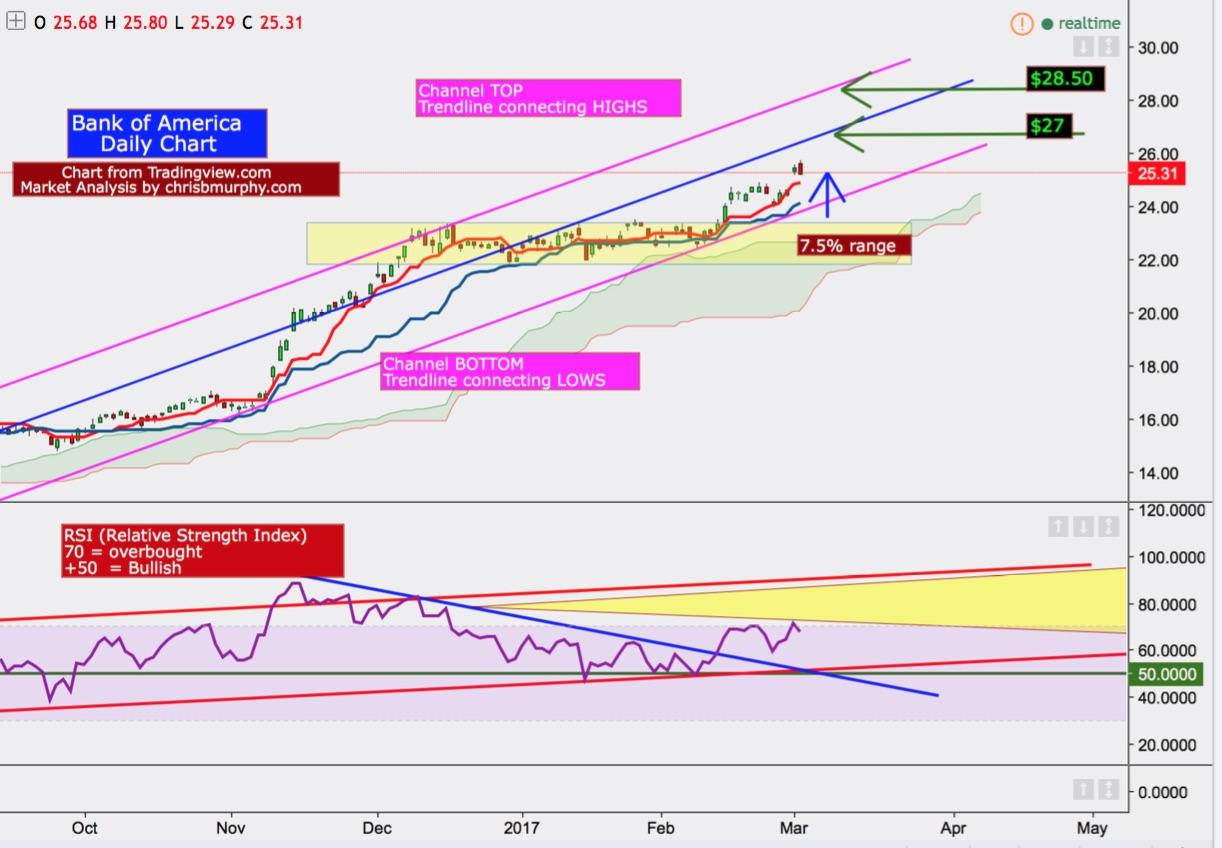
- With RSI, we can see momentum broke the blue trendline connecting the RSI highs in momentum (bullish sign).
- Also, we bounced off the 50 line (green line) as we highlighted the necessity in the January article.
What to watch for:
- Be sure to match momentum with price so that RSI makes higher highs while BAC makes higher highs.
- As a result, we want to watch to see RSI move higher and trade into the yellow zone, (passes the prior highs in January & February).


