Summary
ETP is a midstream MLP which traded recently at $20.50 and yields 10.5%.
The stock has pulled back recently due to a complex merger and a distribution cut, creating shareholder morale issues.
ETP has strong growth projects coming online and could see massive DCF growth in the next two years.
The stock is currently seeing upgrades. Using analysts' ratings and price targets, ETP offers a 40% potential upside.
Based on our conservative assumptions, ETP share has at least 30% upside potential in addition to a growing yield which is likely to reach 15% by the year 2019.
This research report was jointly produced with High Dividend Opportunities co-author Philip Mause.
Energy Transfer Partners, L.P. (ETP), is an MLP (issuing K-1s) which has been declining in recent weeks. ETP traded recently at $20.50 and pays a distribution of $2.14 per year for a yield of 10.5%. ETP has just been through a somewhat confusing merger and an effective distribution cut which have created shareholder morale issues. ETP has multiple strong growth projects coming online and should see considerable growth in cash flow leading to higher distributions.
The Merger - ETP recently merged with Sunoco Logistics Partners (whose symbol was formerly SXL). We wrote about the merger in the following article: Merger Between SXL And ETP
 Although ETP was by far the larger company, the merger was structured in an unusual manner. SXL actually acquired ETP by issuing one and a half shares of SXL for each ETP share. Then, SXL changed its name and its symbol to ETP. The overwhelming majority of shares in the new entity are shares exchanged for pre-existing ETP shares.
The big problem is that - prior to the merger - ETP unit holders were getting a dividend of more than $4 a unit. After the merger, an old ETP unit holder gets 1.5 units of the new ETP and receives only $3.21 in distributions. Thus, the merger effected a kind of "stealth" distribution cut. Less money is going out the door each quarter in distributions from the combined companies than was going out the door prior to the merger. And, we all know how much unit holders "love" distribution cuts.
The Business - ETP's business is best understood as consisting of five segments:
- Interstate Natural Gas Transmission - ETP owns and operates some of the most important interstate natural gas pipelines which serve as the backbone of the nation's energy infrastructure and transport natural gas from production areas to areas of high consumption. ETP's assets include Panhandle Eastern Pipeline, Florida Gas Transmission (50% ownership), and Transwestern Pipeline. All told, ETP has over 18,000 miles of interstate pipelines providing essential services to Florida, California, and the Upper Midwest.
- Intrastate Natural Gas Transmission - ETP has 8,300 miles of pipelines providing intrastate transmission services - largely in Texas. Because of the regulatory history of the industry, a large and distinct intrastate natural gas transmission industry emerged carrying gas from producing areas to chemical plants and other energy intensive users.
- Midstream - ETP has extensive midstream assets - primarily in the Permian, Marcellus, and Eagle Ford regions. It is engaged in a major buildout in the Permian region.
- Crude Oil - Although ETP has been primarily a natural gas oriented MLP, the recent merger added crude oil and refined product infrastructure assets. ETP has major crude oil pipelines serving the most active oil producing regions - including the Dakota Access Pipeline and the Permian Express. ETP has a large truck fleet and storage terminals with 32 million barrels of capacity. ETP provides fee based services and also purchases crude at the well-head for resale to the major oil companies and refineries.
- NGLs and Refined Products - ETP's activities in this area have grown with assets acquired through the merger. ETP has four fractionation plants strategically located to provide service in areas of heavy natural gas production. It also has major natural gas liquids pipelines and terminals. Its natural gas liquids storage facilities have capacity of nearly 60 million barrels. It also has refined products pipelines and terminals.
Growth Projects - ETP has major growth projects which are coming on line in 2017 and the next couple of years. These projects should increase EBITDA and Distributable Cash Flow ("DCF") substantially starting this year and running through 2019. This is the basis for the projections of increased EBITDA (set forth below) that were prepared in connection with the proxy materials associated with the merger. Expansion projects include the Dakota Access Pipeline. This vitally important pipeline will allow crude oil produced to be transported to refineries in the Gulf area. Readers will be aware that it has been subject to environmental opposition and that there is still an unresolved issue in the litigation. Although the pipeline has obtained government agency approval, private litigants continue to oppose it and are arguing that the environmental impact statement filed in connection with the project was inadequate in some respects and that the operations of the pipeline should be suspended pending a revision of the environmental impact statement. It is always hard to predict the outcome of litigation but, in this case, it would seem that the equities would balance in favor of permitting the pipeline to continue operations pending a revision, if necessary, of the environmental impact statement. The pipeline actually started service on June 1. It is such a major improvement in terms of cost and environmental protection in comparison with alternate means of transporting the oil that it will almost certainly achieve ultimate approval although, as noted above, it is possible that a suspension of operations will be ordered, and, as long as the litigation is pending, there will be somewhat of a cloud over the project.
Other growth projects include:
- The Rover Pipeline (scheduled to come on line in July 2017),
- The Panther Processing Plant (January 2017),
- The Arrowhead Processing Plant (Q3, 2017),
- The Comanche Trail and Trans-Pecos (Q1, 2017),
- The Mariner East 2 (Q3, 2017),
- The Revolution System (pipelines and processing plants) (Q4, 2017),
- The Bayou Bridge (Q4, 2017).
These projects are targeted at areas of increased drilling and should all increase ETP's financial performance as we move forward.
Q1 2017 - For Q1, 2017, ETP has prepared a pro-forma financial report setting forth results for the combined company:
- Adjusted EBITDA came to $1.414 billion, and DCF came in at $907 million - with a unit count of 1.084 billion common units.
- ETP distributions totaled $582 million to common units and some $220 million to IDRs.
- If we annualize these numbers, assume no growth, and give common units $50 million credit for the undistributed DCF (the difference between the $907 million in DCF and the $802 million actually distributed to common unit holders and IDRs), we get quarterly DCF of $635 million available to common units and an annual total of roughly $2.540 billion or $2.34 per unit.
- This would imply a Price/DCF ratio of 8.7 times. This is a reasonable price level for a large, well diversified MLP. Unfortunately, the analysis is not so simple due to complexities associated with the IDRs.
The IDR/Relinquishment Issue - Based on recent SEC filings (dated 3/24/2017) the new, merged entity will also have a somewhat complex IDR situation. IDRs kick in at low distribution levels with IDRs set at:
- 13.39% of distributions over 8.33 cents per quarter;
- 35.39% of distributions over 9.58 cents per quarter;
- and 48.33% of distributions over 26.38 cents per quarter.
Distributions are now set at 53.5 cents per quarter. With unit count at 1.084 billion, IDRs would normally have been $377 million for Q1 2017. This would have resulted in total distributions to IDRs and common units of $959 million - considerably more than Q1 2017 DCF of $907 million.
To help solve this problem, the manager - Energy Transfer Equity, L.P.(ETE) - has a "relinquishment" program in effect under which $655.5 million, $153 million, and $128 million in earned IDRs will be relinquished (simply not taken), respectively, for the years 2017, 2018, and 2019. After 2019, there will be a perpetual relinquishment of $33 million per year. Thus, in the past quarter, the new ETP generated some $907 million in DCF and distributed $582 million to unit holders. It would normally have been required to distribute $377 million in IDRs which would have meant that distributions of $959 million would have exceeded DCF. But the relinquishment program reduced IDR distributions by $157 million with the result that total distributions came to $802 million. ETP proudly announced that it had a distribution coverage level of 1.13. Of course, without relinquishment, the distributions would not have been covered at all. Thus, without any growth whatsoever, ETP would likely have to cut distributions sometime in 2018 after the generous 2017 relinquishment levels are replaced by much lower levels of IDR relinquishment. This is because the cost of paying IDR's will increase once the level of IDR relinquishment is substantially reduced (and thus the amount actually paid out in IDRs increases). An investor may reasonably ask - how can distributions increase once IDR relinquishment decreases? The answer is simple: ETP is clearly planning for substantial DCF growth. In fact, its management asserts that it should be able to generate double-digit distribution growth over the next two years.
Growth Projections - ETP is planning for substantial growth in cash flow and has numerous large projects coming online this year and next. ETP is projecting that it will be able to have low double-digit increases in distributions for the next couple of years. This will require very large cash flow increases from these new projects. While ETP has not issued guidance in this regard, it has published projections in its proxy statement (available on its corporate webpage) in connection with voting on the merger. These projections purport to show future results of each of the two merged companies if they were to continue as independent entities. They also include projections of EBITDA for the merged company used by Barclays which was retained in connection with the merger (Barclays report is described in an SEC filing dated 3/24/17 - a proxy statement - at page 92). We have calculated DCF for the merged company by subtracting $2 billion a year to account for interest payments and maintenance capital expenditures. This $2 billion per year estimate is based upon an annualization of the amount by which EBITDA exceeded DCF in the first quarter of 2017 - which was roughly $500 million. When we subtract this $2 billion from each year's EBITDA estimate for the merged companies, we derive an estimate of the annual DCF for the merged companies. The tables below show projections for each of the original companies as standalone entities and a projection for the merged entity. All numbers are in billions of dollars.
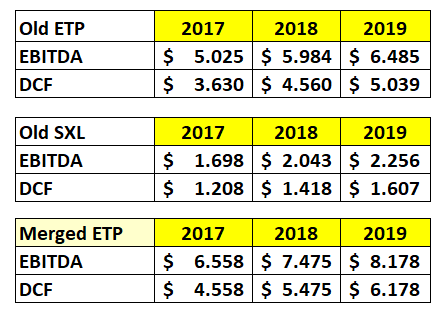
Investors should be aware, however, that these projections cannot be taken to the bank and spent today. They assume, for example, that the oil price will be $50 in 2017, $55 in 2018, and $60 in 2019. While ETP is not directly exposed to the oil price the way oil companies are, volumes on its pipelines would be affected by the level of drilling in the United States which would, in turn, be affected by the oil price. The projections also assume a constant unit count of roughly 1.1 billion common units. In addition, the DCF projection for the merged companies is not from Barclays but instead uses the EBITDA projection used by Barclays and then assumes that interest plus maintenance capital expenditures will continue to equal the roughly $500 million per quarter experienced in the first quarter of 2017. It is entirely possible that this offset will increase due to higher interest rates, increased debt due to capital expenditures, and increased maintenance capital expenditures due to additional facilities. For all of these reasons, we have made some conservative assumptions to arrive at a valuation. If the newly merged ETP can hit these numbers (or anything reasonably close to them), this stock will be a huge winner. Management is projecting double-digit distribution increases in the "near term".


