Showing posts with label Investment. Show all posts

Thursday, September 28, 2017

Roku skyrockets on opening day of trading—jumps more than 50%

Image result for roku tv

  • Roku had $398.6 million in revenue last year, up 25 percent from $319.9 million in 2015.
  • It posted a net loss of $42.8 million in 2016, steeper than the $40.6 million the year before.
  • The company priced its 18 million share offering at $14 per share on Thursday, the high end of the expected range.


  • Roku CEO on IPO: Our goal is to power every TV in the world from CNBC.

    Roku skyrocketed more than 50 percent above its IPO price on Thursday, as the entertainment technology company made its public debut.
    The company, which makes most of its money from selling streaming video players, listed its $252 million IPO on the Nasdaq under the trading symbol ROKU.
    The company priced its 18 million share offering at $14 per share on Thursday, the high end of the expected range of between $12 per share and $14 per share. Shares opened for trading at $15.78 a piece.
    Roku had $398.6 million in revenue last year, up 25 percent from $319.9 million in 2015. But the Los Gatos, Calif.-based company still loses money: It posted a net loss of $42.8 million in 2016, steeper than the $40.6 million the year before.
    In addition to sales of Roku players and TVs, the company has been expanding its advertising business. It's hoping to grow the number of hours streamed by each user, and monetize the hours through advertising, according to its prospectus.
    The IPO comes as more and more companies look to take a slice of the video-streaming market. Advertising giant Facebook has deepened its ambitions in video streaming, and Apple and Amazon debuted new high-definition streaming devices this month.
    Founder and CEO Anthony Wood told CNBC ahead of the IPO the company isn't worried about its heavyweight competitors.
    "Roku's position in this ecosystem is being the platform that ties together the customers, the advertisers, the user, and we've been competing with big companies for a long time very successfully," Wood said on CNBC's "Squawk Box."
    Wood — a former Netflix executive who played a role in the invention of the DVR — will own 27.3 percent of Roku's stock, and will control approximately 32.1percent of the voting power, the prospectus said.
    Other major backers include Menlo Ventures, Twenty-First Century Fox and Fidelity. The IPO's underwriters include Morgan Stanley, Citigroup, Allen & Company and RBC Capital Markets.

    Source: https://goo.gl/8JJNtX

    By Anita Balakrishnan

    Thursday, August 10, 2017

    5 Small Cap Value Stocks to Buy Now

    Image result for ZAGG Inc.

    UCTT SRI MHO TSQ ZAGG
    Every week, Tracey Ryniec, the editor of Zacks Value Investor portfolio service, shares some of her top value investing tips and stock picks.
    2017 is the year of the large cap growth stocks. That has left value investors in the wilderness, especially small cap value investors.
    Small cap value has, historically, outperformed growth, but not this year.
    Small Cap Value Down in the Dumps
    Year-to-date, the iShares Small Cap Value ETF (IWN) is down about 1%. But the small cap growth ETF (IWO) is up 9.3% during that same time. That’s a huge 10% swing.
    But that means that small cap value stocks are actually on sale. Value investors have an opportunity to add to their positions at attractive valuations.
    Tracey ran a screen to find small cap value stocks with P/Es under 15, P/S ratios under 1.0 and a Zacks Rank of #1 (Strong Buy) or #2 (Buy). Despite the narrow parameters, the screen gave her 15 quality stocks to choose from.
    What are you waiting for? These small cap stocks have value and several even have dynamic growth.

    1.    
     Townsquare Media (TSQ - Free Report) is a media, entertainment and digital marketing company that owns radio stations and websites. It trades with a forward P/E of 9.6.5 Small Cap Value Stocks to Buy Now
    2.    Ultra Clean Holdings (UCTTFree Report) develops critical systems for the semiconductor and flat panel industries. Revenue was up 75.8% last quarter. It has a forward P/E of just 12.1.
    3.    Stoneridge Inc. (SRI - Free Report) makes electronic components for the auto and truck industries including driver information systems, sensors, and tracking devices. It’s cheap, with a forward P/E of 11.5.
    4.    M/I Homes (MHO - Free Report) is one of the small homebuilders. It saw record revenue, homes delivered and new contracts in the second quarter. The homebuilders are dirt cheap. MHO has a forward P/E of just 8.4.
    5.    ZAGG Inc. (ZAGG - Free Report) makes screen protection, mobile keyboards and owns Mophie, which is one of the top selling battery cases for mobile phones. Sales are expected to rise 21% this year. It has a P/S ratio of just 0.6.
    For investors, small cap stocks can be riskier than large cap stocks, due to their volatility, but the payoff can also be greater. These are just a few names that have solid fundamentals.
    By Tracey Ryniec

    Saturday, April 1, 2017

    Tech company Cloudera files for IPO, looks to raise up to $200 million

    Image result for Cloudera

    Technology firm Cloudera filed for its public offering on Friday amid a revival in the IPO market.
    • What they're hoping to raise: up to $200 million 
    • Revenue: $261.0 million in the year ending Jan. 31, up from $166.0 million a year ago
    • Net loss: $187.32 million, narrower than the $203.14 million from a year ago
    • Underwriters include Morgan Stanley, JPMorgan, Allen & Company
    • Headcount: 1,470 employees as of Jan. 31, up from 1,140 employees the prior year
    The firm will list on the New York Stock Exchange under the symbol CLDR, according to regulatory filings. The company is growing its sales and shrinking its losses, though it still lost $187.32 million last year amid "significant investments in research and development" and outlays for sales and marketing.
    Cloudera has raised cash on the private market from investors like Intel and T. Rowe Price, and is estimated to be valued at $4.1 billion, according to CB Insights. Intel owns about 22 percent of the shares, while Accel and its affiliates own about 16.3 percent and Greylock owns about 12.5 percent.
    The Palo Alto, Calif.-based company was founded by alumni from Oracle, Yahoo, Facebook and Google, and also boasts leadership from the co-creator Hadoop — of one of software developers' most beloved technology frameworks.
    Image result for Cloudera
    Cloudera specializes in one of the hottest fields for enterprise technology: Data science. It makes 77 percent of its money from subscriptions.
    But the company faces what it calls "intense competition," both from enterprise technology companies like IBM and Oracle, and from cloud providers like Amazon and Microsoft that are bolstering their business intelligence offerings.
    To grow its business, Cloudera has scooped up other start-ups including Gazzang and Xplain.io, it said. Cloudera said the company intends to continue to expand internationally after the IPO, and will use the proceeds for activities like sales and marketing, research and product development.
    With rumors of the offering stretching back to 2014, Cloudera's IPO has been long-awaited. Cloudera rival Hortonworks, which priced its IPO at $16 a share in 2014, has since cratered and traded at less than $10 a share on Friday. (Hortonworks shares rose nearly 2 percent after Cloudera's filing was released).
    But this year, tech IPOs like SnapMuleSoft and Alteryx have primed the market. U.S. IPOs raised $9.9 billion during the first quarter of this year, according to Renaissance Capital, up from just $667 million in the year-ago period.
    Having incurred net losses since its founding in 2008, Cloudera said it does not intend to pay any cash dividends on common stock in the foreseeable future.
    The confluence of "big data," the rise of the cloud, and Google's search technology helped companies like Cloudera get started, Mike Olson, co-founder, chairman and chief strategy officer, wrote in a letter to investors.
    "Google, Facebook and Yahoo had discovered big data before anyone else, but it was obvious that it was coming to banks, hospitals and other traditional companies," Olson said.

    Thursday, March 30, 2017

    Collect Smokin' Hot Profits From This Marijuana Biotech

    This innovative biotech offers investors an intriguing play on the medical marijuana business.

    Without a doubt, medical marijuana is one of the hottest corners of the biotechnology sector for investors. The potential this apparent wonder-herb packs for alleviating symptoms of countless diseases, as well as its curative properties, makes biotech companies developing cannabis-based treatments among the most exciting and potentially lucrative investment opportunities today.
    Just take a look at the 1,300%-plus gains GW Pharmaceuticals (GWPH) has given its investors in the last five years.
    However, the election of Donald Trump and his appointment of the notoriously anti-pot Jeff Sessions as attorney general have frightened away some investors who could be reaping in the profits of the coming Green Wave.


    While the majority of Americans now favors the widespread legalization of cannabis, it looks like the federal government's resistance isn't going to change soon (although expected legalization in Canada might change minds in Washington).
    Most of the biotechs working in this sphere use synthetic cannabinoids and skirt around the legalities of grown marijuana. This is paying off big-time for GW Pharmaceuticals, as well as other companies like Zynerba Pharmaceuticals (ZYNE) and Insys Therapeutics (INSY) . (Controversy erupted this week when Insys received the FDA's blessing for its synthetic THC product after vocally lobbying against the legalization of the actual plant.)
    But there's another company in the medical marijuana space worth watching that's on the rise22nd Century Group (XXII) . This relatively small but well-financed biotech focuses on genetic engineering and plant breeding and is developing a new strain of hemp with zero THC, the main psychoactive compound found in cannabis (and what is keeping pot illegal on a federal basis).
    And apart from medical uses, a THC-free plant would have huge ramifications for the industrial hemp industry, which is all but crippled here in the U.S. Hemp is one of the world's most sustainable and practical basic materials, yet has been illegal since 1970.
    "We are delighted that our exciting research... has created zero-THC plants and altered levels of cannabinoids suitable for both industrial hemp and medical marijuana," said 22nd Century's vice president for plant biotechnology, Paul Rushton. "We anticipate that our zero-THC hemp plants will form the basis for a new generation of industrial hemp and medical marijuana varieties. These markets are projected to be a multi-billion dollar markets in the near term."
    However, 22nd Century also has another exciting innovation up its sleeve, diversified away from the cannabis industry. This should yield the company and its investors sustained profits whenever pot becomes legalized in the U.S.
    The biotech firm is creating genetically engineered tobacco plants to have either 97% less nicotine than conventional strains, as well as a strain high in nicotine that allows for the lowest tar-to-nicotine ratio in the cigarette industry.
    The low-nicotine variety has proven effective in helping smokers kick the habit and is gaining the support of tobacco scientists worldwide. "The applications for this technology are extraordinary and could generate hundreds of millions of dollars in revenue for our company," the 22nd Century Group has said. "In independent clinical studies, our very low-nicotine tobacco has demonstrated remarkable efficacy as a smoking cessation aid." Investors should keep an eye on this exciting and smokin' hot stock.
    Source:https://www.thestreet.com/story/14066655/1/collect-smokin-hot-profits-from-this-marijuana-biotech.html

    Wednesday, March 15, 2017

    Five Stocks Under $5 to Buy Now

    Image result for Stocks Under $5
    Low-priced stocks can present immense opportunities if purchased at the right time. Several factors affect stock prices, including broader market disruption, negative news, bad quarters, or temporary product failures. Even slight delays in product launches can knock down stock prices, as can technical trading run amok, presenting a great opportunity for buyers who know when to pounce on declines.
    Low-priced stocks do not necessarily equate to low-market cap companies and greater risk, as the stock price is a combination of number of shares in circulation and market cap. Nonetheless, low-priced stocks may also have an undeserved reputation among inexperienced investors as being too volatile to invest in.
    In this article we will share 5 of the best under-$5 stocks which you can buy now. These stocks have huge potential for growth in the future, which is why they’re extremely popular among the collection of top hedge funds in our database, which includes many of the 140 Biggest and Most Famous Activist Hedge Funds in the world. Read on to find out what stocks made the list.
    At Insider Monkey, we’ve developed an investment strategy that has delivered market-beating returns over the past 12 months. Our strategy identifies the 100 best-performing funds of the previous quarter from among the collection of 700+ successful funds that we track in our database, which we accomplish using our returns methodology. We then study the portfolios of those 100 funds using the latest 13F data to uncover the 30 most popular mid-cap stocks (market caps of between $1 billion and $10 billion) among them to hold until the next filing period. This strategy delivered 39.7% gains over the past 12 months and outperformed the 24.1% gain enjoyed by the S&P 500 ETFs. Our enhanced small-cap hedge fund strategy returned more than 45% over the last 12 months and outperformed SPY by more than 30 percentage points over the last 4.5 years (see details here).
    1. Avon Products, Inc. (NYSE:AVP)
    Image result for Avon Products, IncAvon is a New York-based company which sells beauty and personal care products. Last month, Avon shares lost a lot of value amid a disappointing fourth quarter report. Avon’s revenue declined by 2.4% during the period to $1.57 billion, while analysts’ were expecting revenue of $1.61 billion. However, investment firm Jefferies reiterated its ‘Buy’ rating on the company, along with a price target of $8, suggesting nearly 100% upside potential. The firm thinks that Avon’s valuation is compelling and that its long-term goals are achievable. A total of 31 hedge funds tracked by Insider Monkey were bullish on Avon Products, Inc. (NYSE:AVP) heading into 2017, owning 12.7% of the company’s shares.
    2. Office Depot Inc (NASDAQ:ODP)
    Image result for Office Depot Inc
    Office Depot Inc (NASDAQ:ODP) recently posted upbeat results for its fourth quarter and fiscal year 2016, though the market has been rather tepid towards the stock this year. The office supplies retail company posted sales of $2.73 billion for the fourth quarter, versus the FactSet consensus of $2.70 billion, while EPS of $0.11 was also above the Street’s forecast of $0.10. Full-year sales of $11 billion were down by 6% from 2015. Office Depot’s new CEO Gerry Smith said in a statement that he has developed a three-year ‘strategic plan’ for profitability improvement and shareholder returns. A total of 31 hedge funds tracked by Insider Monkey were long Office Depot Inc (NASDAQ:ODP) as of the end of the fourth quarter, with their positions valued at over $277 million.
    3. SUPERVALU INC. (NYSE:SVU)
    Image result for SUPERVALU INCSUPERVALU INC. (NYSE:SVU) is trading at new lows and presents an attractive bargain. The Minnesota-based retail company’s earnings per share in its fiscal third quarter came in at $0.05, on $3 billion in revenue, worse than the Street’s projections of $0.13 in EPS and $3.79 billion in revenue. SUPERVALU’s CEO Mark Gross said in a statement that the sale of its Save-A-Lot supermarket business in the fourth quarter will help the company grow its business and operations. In January, RBC Capital analyst William Kirk reiterated his ‘Buy’ rating on SUPERVALU INC. (NYSE:SVU) and said that the company’s macro trends are beginning to improve. As of the end of the fourth quarter, 29 hedge funds in our database were long SUPERVALU INC. (NYSE:SVU), including Cliff Asness’ AQR Capital, which owned 2.64 million shares on December 31.

    Sunday, March 5, 2017

    Weighing The Week Ahead: Will A More Aggressive Fed Kill The Stock Rally?

    Image result for stock market

    About: SPDR S&P 500 Trust ETF (SPY)QQQDIASHIWMTZASSOTN

    Summary

    Economic data remain solid.
    The Fed is signaling a more aggressive plan for rate hikes.
    President Trump sounded some notes of compromise (important) but the policy agenda is still uncertain.
    Markets have historically done fine during early stages of rate increases, especially when starting at a low level.
    Key Question: Will the Fed raise rates even in a sluggish economy?
    The economic calendar is light until the Friday employment report. Most of the punditry are still digesting the more aggressive talk in the recent speeches from Fed participants. With many observers expecting a correction and looking for a catalyst, pundits will be asking:
    Will a more aggressive Fed derail the rally in stocks?
    Personal Notes
    I have a vacation coming in a couple of weeks. I will not write WTWA next weekend, and possibly not the weekend after that. I will still be following the markets and email. I will join in if it seems needed. The Stock Exchange group is supposed to keep working.
    Last Week
    Last week the news was mostly positive, and stocks responded again.
    Theme Recap
    In my last WTWA I predicted a discussion about whether stock prices had lost touch with reality. That was a good guess. There was plenty of talk about market valuation. Those bearish also questioned the lack of specifics in the Presidential Address to Congress – which had a greater immediate effect that the annual Buffett letter.
    The Story in One Chart
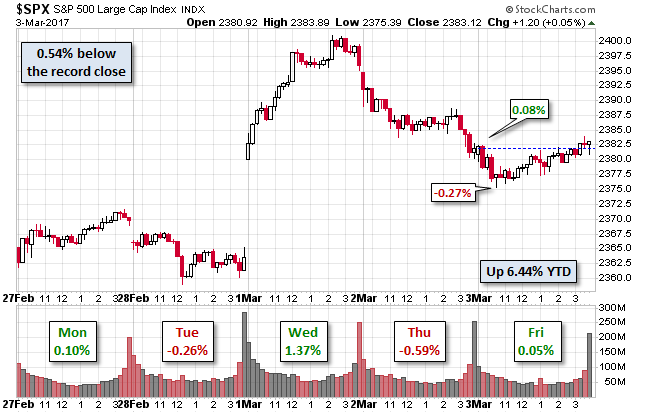
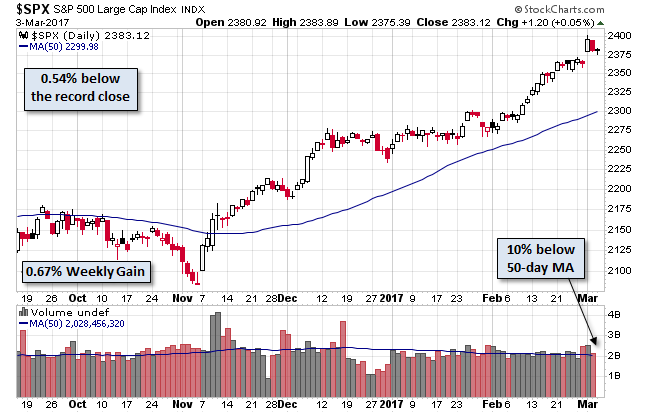
    I always start my personal review of the week by looking at this great chart from Doug Short via Jill Mislinski. She notes yet another record close based on the week’s gain of 0.67%. We can also see the gap opening after the Presidential Address to Congress.
    The rally story is even clearer in this chart, when it begins before the election.
    Doug has a special knack for pulling together all the relevant information. His charts save more than a thousand words! Read his entire post for several more charts providing long-term perspective, including the size and frequency of drawdowns.

    The News

    Each week I break down events into good and bad. Often there is an “ugly” and on rare occasion something very positive. My working definition of “good” has two components. The news must be market friendly and better than expectations. I avoid using my personal preferences in evaluating news – and you should, too!
    This week’s news was mostly positive.
    The Good
    • Durable goods orders increased 1.8% after last month’s decline. Most of the increase was from the volatile transportation sector, but it was still a welcome boost.
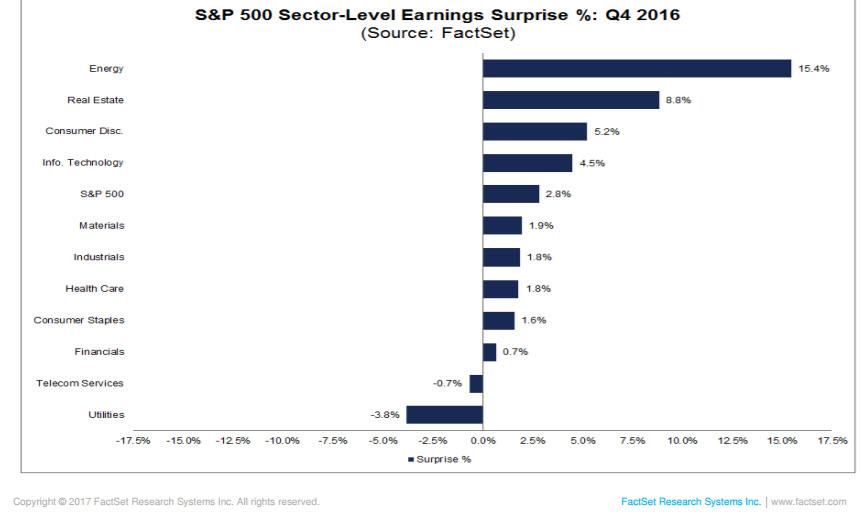
    • Earnings news was positive. Brian Gilmartin emphasizes the favorable trend in estimate revisions. FactSet reports that the earnings and revenue beat rates are slightly lower, but outlook is stronger. Here is an interesting chart of surprises by sector.
    • Investor sentiment turned more bearish. The AAII reports that sentiment is within historic ranges, but off recent highs. This is unusual given past behavior in a rising market. I score it as “good” since most regard it as a contrary indicator.
    • Mortgage delinquency rate falls below 1%, the lowest since June, 2008. (Calculated Risk).
    • ISM Non-Manufacturing rose to 57.6 (from 56.5). The employment index also moved higher. February was stronger than January.
    • ISM manufacturing increased to 57.7 beating expectations and showing a solid increase over last month’s 56.1. The Chicago regional survey was also very strong.
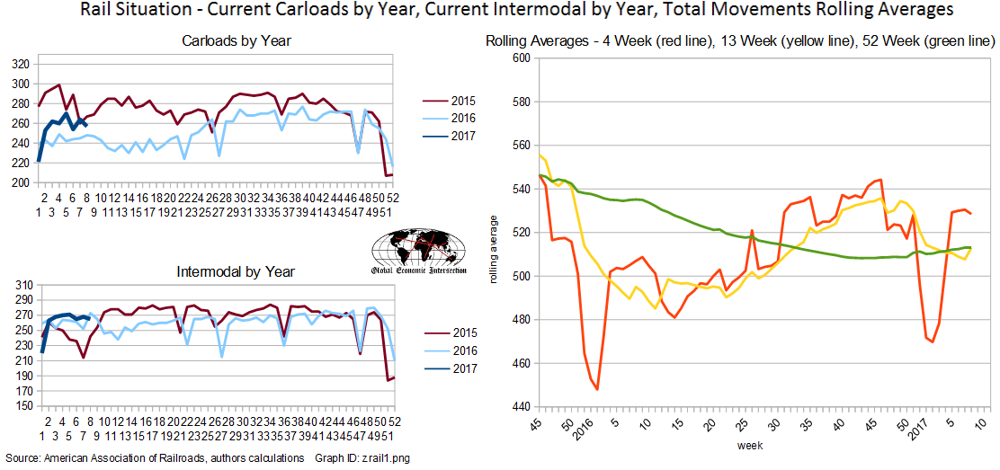
    • Rail traffic in February was 4.2% higher than a year ago. Steven Hansen takes the look at the data we have come to expect, including various moving averages and trends. Read the whole post, but this chart captures some key points, especially the improvement over the last two years.
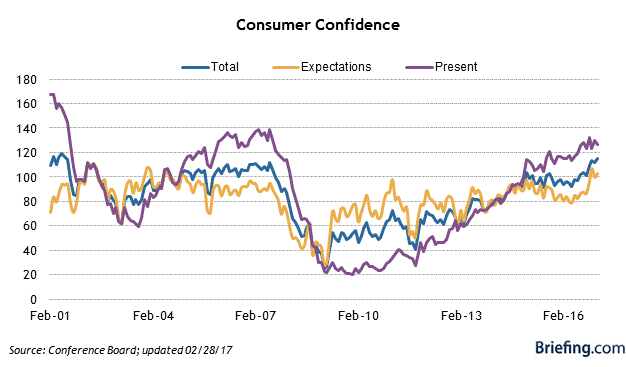
    • Consumer confidence spiked to 114.8, a post-recession high. Briefing.com covers this series.
    • Initial jobless claims rose slightly on the week, but dropped to the lowest level since 1973 on the widely-followed four-week moving average. (Calculated Risk).
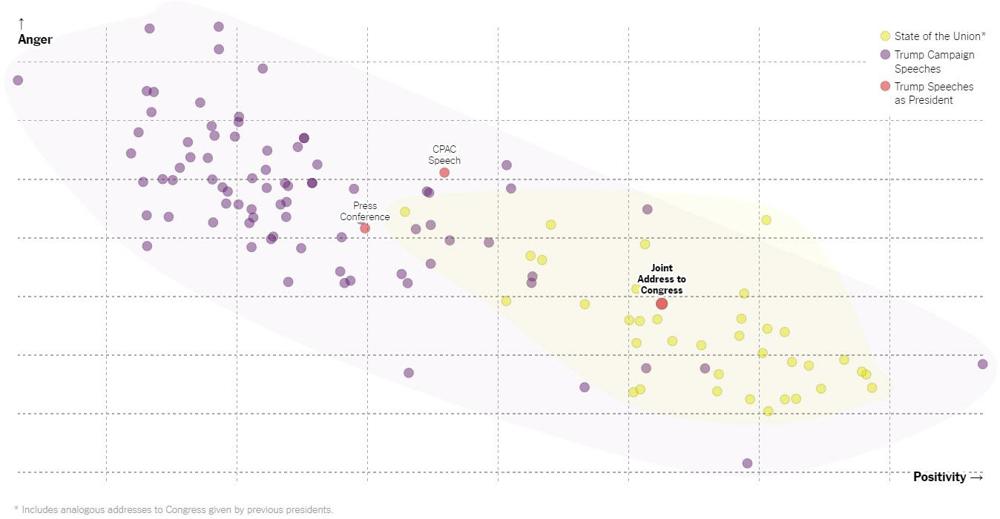
    • President Trump’s speech was very well-received. Most preview articles mistakenly emphasized the need for specifics. Commentators right after the speech did the same. My own preview did not provide advice on what to go out and trade right after the speech. Instead, I drew upon experience and the current policy environment to highlight the key element – the potential for compromise. This chart shows the dramatic shift in this Trump presentation, more like SOTU speeches than nearly anything else he has done. (The Upshot)
    The Bad
    • Construction spending fell 1%.
    • Money supply is drifting to the neutral range – possibly even tilting negative. (New Deal Democrat). Despite complaints about Fed policy, this is a possible economic drag.
    • Pending home sales fell 2.8% and December was revised lower.
    • Debt Limit will be reached in mid-March. Even the extraordinary efforts will be exhausted in September or October. Will this play out any better with a GOP President and Congress? Douglas A. McIntyre has a good story on this issue.
    The Ugly
    My concern about hacking and threats to the Internet’s weak spots continues. Rick Paulas’s article is not about events from last week, but is just as relevant. Perhaps even more so with the Barron’s cover story on robots.
    The article explains that even rather unsophisticated attacks can work on the 6.4 billion Internet of Things devices in use. Little is being done to protect on this front.
    The Silver Bullet
    I occasionally give the Silver Bullet award to someone who takes up an unpopular or thankless cause, doing the real work to demonstrate the facts. No award this week. Nominations are welcome. Potential award winners can find daily inspiration at several websites!

    The Week Ahead
    We would all like to know the direction of the market in advance. Good luck with that! Second best is planning what to look for and how to react. That is the purpose of considering possible themes for the week ahead. You can make your own predictions in the comments.

    Thursday, February 23, 2017

    The 10 Best Stock Charts on Wall Street Right Now

    Many of the top-looking stock charts at the moment are turnaround plays


    Image result for stock market

    The Dow Jones Industrial Average continues to melt to incremental new highs, seemingly oblivious to the build up of overbought technical indicators, extreme bullish sentiment, and the risk of more aggressive interest rate hikes from the Federal Reserve. Stock charts are an amazing thing to watch right now, with breakouts popping up left and right.
    While some of the other major averages are dithering here (ahem, Nasdaq, ahem) the Dow Jones is steadfast.
    Breadth has been an ongoing concern as buying interest has been focused on areas like financials and industrials. So assuming the uptrend is going to continue, buying interest will need to widen. Nonetheless, a number of stocks look ready to roar, and they come across a number of sectors — from tech to consumer staples to even utilities.
    The following is what I believe the 10 best stock charts on Wall Street right now — and many of them are comeback stories.

    Best Stock Charts Right Now: Square (SQ)

    Best Stock Charts Right Now: Square (SQ)
    Square Inc (NYSE:SQ) pushed to fresh post-IPO highs on Thursday, surging up and out of its upper Bollinger Band in a powerful show of force and breaking out of the uptrend channel that started back in June.
    The catalyst for Square’s stock chart breakout was the reporting of better-than-expected revenues and earnings and solid forward guidance.
    Analysts at Canaccord Genuity raised their price target on the payment processor, as concerns about competitive dynamics and profitability pressure have been alleviated. Their PT was upgraded from $14 to $16 — more or less just playing catch-up with recent gains.
    Square will next report results on May 24 after the close. While SQ might need time to consolidate these gains, the stock looks like it’s off to the races for now.

    Best Stock Charts Right Now: Verizon (VZ)

    Best Stock Charts Right Now: Verizon (VZ)
    Shares of wireless telecom giant Verizon Communications Inc. (NYSE:VZ) are on the move in a big way, lifting out of a month-long consolidation range between $49 and $48 to lift up and out of its upper Bollinger Band.
    Investors have been encouraged by the company’s ability to lower its acquisition price for Yahoo! Inc. (NASDAQ:YHOO) by $350 million in response to an embarrassing data breach. The next time we’ll hear anything from the company on the earnings front will be April 20 before the bell, when analysts will hope to see profits of 99 cents per share on revenues of $30.7 billion.
    Technically speaking, VZ has one of the more hopeful-looking stock charts right now. Verizon looks ready to challenge the 50-day and 200-day moving averages before making another attempt at its summertime high near $55, which was unsuccessfully tested in early January.

    Best Stock Charts Right Now: Groupon (GRPN)

    Best Stock Charts Right Now: Groupon (GRPN)
    Groupon Inc (NASDAQ:GRPN) shares have blasted higher — up and out of their upper Bollinger Band and above its 200-day moving average — to fill the chart gap around $4.50 from the surge in July and the decline in October.
    Shares surged in response to better-than-expected quarterly numbers, noting solid consumer activity in December as confidence bounced back after the election.
    RBC Capital analysts highlighted the company’s fourth consecutive quarter of adding more than 1 million users in the North American region.
    The company will next report results on April 27 after the close. Analysts are expecting a break even on revenues of nearly $730 million. Between then and there, Groupon will look to challenge the $5 area — the lower part of a range where GRPN traded from September through November before bottoming out.

    Best Stock Charts Right Now: TJX (TJX)

    Best Stock Charts Right Now: TJX (TJX)
    TJX Companies Inc (NYSE:TJX) is among the best stock charts in retail right now, testing levels not seen since late November.
    The stock has been flatlining since last February centered on the $78-a-share level. But renewed interest after a solid earnings report could reinvigorate interest in the discount retailer. The company reported better-than-expected earnings of $1.03 per share (3 cents ahead of estimates) on a 6% jump in revenues. Management also announced a 20% increase to its dividend.
    Right now, TJX is breaking up and out of their upper Bollinger Band. This could be a possible attempt to challenge last summer’s highs around $83.

    Best Stock Charts Right Now: Walmart (WMT)

    Best Stock Charts Right Now: Walmart (WMT)
    Wal-Mart Stores Inc (NYSE:WMT) shares are gapping higher, lifting up and out of a downtrend channel that started last summer.
    The move comes after the reporting of solid quarterly results: Walmart earnings of $1.30 per share beat estimates by a penny on a 1.8% jump in U.S. comp-store sales (vs. 1.0%-1.5% guidance). The increase was driven more by customer traffic rather than average ticket, which is a positive sign suggesting a shift in behavior that could be long lasting.
    The company’s next report isn’t until May 18, when analysts will want to see 96 cents per share on revenues of $117.1 billion.
    Currently, WMT stock is challenging its December highs. The next big price level after that is above $74.50, which Walmart touched this August.

    Best Stock Charts Right Now: Johnson & Johnson (JNJ)

    Best Stock Charts Right Now: Johnson & Johnson (JNJ)
    Johnson & Johnson (NYSE:JNJ) shares are continuing their powerful march higher, returning to levels not seen in August after crossing above both its 50-day and 200-day moving averages, exiting a five-month basing range with support near $112-$110.
    The rally stands in contrast to the slippage in late January after Johnson & Johnson reported disappointing fourth-quarter sales and issued weak forward guidance.
    The rally is being fueled, it seems, by a search for value among large-cap investors.
    JNJ will next report results on April 18 before the bell. Analysts are looking for earnings of $1.76 per share on revenues of $17.98 billion. Edge Pro subscribers recently closed a position in the March $115 JNJ calls for a gain of nearly 170%.

    Best Stock Charts Right Now: Colgate-Palmolive (CL)

    Best Stock Charts Right Now: Colgate-Palmolive (CL)
    Colgate-Palmolive Company (NYSE:CL) shares are going vertical, pushing past their summertime highs to hit new records — up a whopping 17%-plus from late January.
    The catalyst has been intense M&A activity in the consumer staples space, with a $150 billion-plus bid for Unilever N.A. (ADR) (NYSE:UN) from Kraft Heinz Co (NASDAQ:KHC) making headlines. Although the bid was rejected, it’s raising valuations across the sector. This was great news for shareholders after the company missed sales estimates in its latest quarterly report.
    Colgate will next report results on April 28 before the bell. Analysts are looking for earnings of 66 cents per share on revenues of $3.9 billion.
    Right now, the ceiling on CL shares has been removed.

    Best Stock Charts Right Now: Unilever (UN)

    Best Stock Charts Right Now: Unilever (UN)
    Unilever N.V. (ADR) (NYSE:UN) shares — the ADRs traded here in New York — are consolidating their post-M&A announcement surge near last September’s highs which in turn capped a multi-month consolidation range.
    While Unilever rejected the offer from Kraft Heinz as too low, resulting in the bid being pulled (as mentioned above), this was quickly followed up with an announcement of a comprehensive review of options to boost shareholder value.
    KHC may well continue to circle the company, especially if shareholders lose patience with management.
    For now, let speculation be your friend as UN pushes new heights.

    Best Stock Charts Right Now: Duke Energy (DUK)

    Best Stock Charts Right Now: Duke Energy (DUK)
    Duke Energy Corp (NYSE:DUK) looks like one of the best stock charts in the utility sector, with DUK rising up and out of an inverse head-and-shoulders reversal pattern that started in October. Shares are above their 200-day moving average as they extend above the upper Bollinger Band.
    Although the company reported weaker-than-expected earnings on Feb. 16, shares are being propelled by a surge of buying interest in the entire utilities space. Thus, Duke’s next report isn’t for a while — May 2, before the bell, when analysts will look for a bottom line of $1.08 per share on a top line of $6.1 billion.
    In the meanwhile, watch for a run at the July high near $84.50.

    Best Stock Charts Right Now: Southern Co (SO)

    Best Stock Charts Right Now: Southern Co (SO)
    Speaking of utilities, Southern Co (NYSE:SO) shares are blazing up and out of a four-month basing pattern while also rising up and over their 200-day moving average and upper Bollinger Band.
    The impressive demonstration of upside strength on Southern’s stock charts breaks a downtrend pattern that started last summer and follows the reporting of mixed quarterly results: Earnings of 24 cents per share missed estimates by 6 cents, but revenues rose 45% from the prior year to $5.18 billion vs. the $4.4 billion expected.
    The company, which next reports on May 24 before the bell, is benefiting from renewed interest in yield-sensitive utility stocks as long-term interest rates stall out.
    Anthony Mirhaydari
    Source:http://investorplace.com/2017/02/the-10-best-stock-charts-on-wall-street-right-now/view-all/#.WK-U2_krI2w