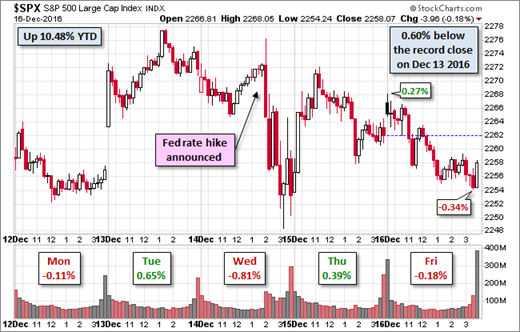
There is a normal dose of economic data this week, but we are entering a quiet, pre-holiday period. As the rally faltered a bit, the Dow 20K talk yielded to a discussion of what could go wrong. I expect this discussion to continue in the coming week, and perhaps the next one as well. The punditry will be asking:
What can derail the rally?
Last Week
In a reversal from the last month, most of the economic news was soft. There was little apparent market effect.
Theme Recap
In my last WTWA,
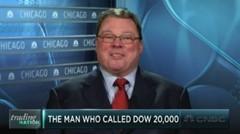
I predicted a week-long fixation on the Dow 20K story. That was very accurate, with the closest call coming just as I arrived at Chicago's NBC tower for a
CNBC interview on my 2010 forecast. I think it represents a delay rather than a jinx.
Some might attribute the selling to the Fed and Chair Yellen's press conference, an "effect" that was reversed the next day. It must have been me. I'll stay at the office for the rest of the year!
The Story in One Chart
I always start my personal review of the week by looking at this
great chart from Doug Short. He captures the continuing rally and the move to new highs.
Doug has a special knack for pulling together all the relevant information. His charts save more than a thousand words! Read his entire post where he adds analysis grounded in data and several more charts providing long-term perspective.
Personal
I will have several year-end posts planned for the next two weeks, but will probably skip WTWA next weekend. I am planning a Weighing the Year Ahead installment, probably in two weeks.
https://funds.gofundme.com/dashboard - thanks for your support
The News
Each week I break down events into good and bad. Often there is an "ugly" and on rare occasion something very positive. My working definition of "good" has two components. The news must be market friendly and better than expectations. I avoid using my personal preferences in evaluating news - and you should, too!
This week's news was quite good-almost all positive. I make objective calls, which means not stretching to achieve a false balance. If I missed something for the "bad" list, please feel free to suggest it in the comments.
The Good
- Framing lumber prices are higher, year over year. Calculated Risk sees this as an important leading indicator for housing, so we should, too.
- Initial jobless claims edged lower, to 254K.
- Hotels are close to an occupancy record. (Calculated Risk).
- The Fed provided the expected increase in rates with almost no market reaction. (That is the good part). Tim Duy provides some insight. See also "Davidson" via Todd Sullivan.
- The Philly Fed showed a big gain to 21.5 (7.6 prior) and trouncing expectations. I am not very interested in the Empire State survey, but it mirrored the Philly result. Business and consumer confidence have both strengthened since the election. Confidence is essential for spending, investment, and economic strength.
- Inflation is still tame, even as it creeps toward the Fed's target.
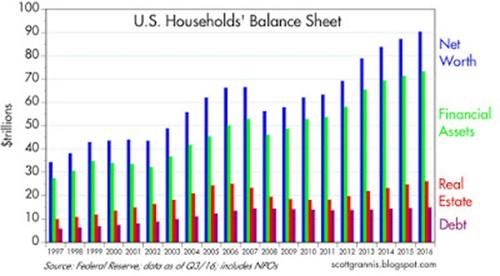
- Household balance sheets are much stronger. Scott Grannis regularly produces this chart. It is far more valuable than material from those focusing exclusively on debt and ignoring assets.
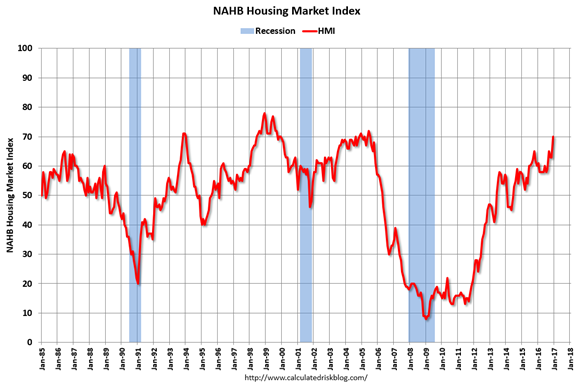
- Homebuilder confidence hits the highest level since 2005. (Calculated Risk).
The Bad
- Industrial production declined by 0.4% from October to November.
- The rail contraction continues. Steven Hansen continues his coverage with multiple takes and time frames. Check it out!
- China/drone incident. The drone seizure coincided with Friday selling, a hint of market reaction to sensitive international issues. China will return the drone and claims that the story was "hyped up."
- High frequency indicators edge lower. NDD's useful weekly compilation shows continuing strength in short leading indicators, neutral in the coincident group, and some weakness in the long term. He is downplaying the effects due to seasonality, but it bears watching.
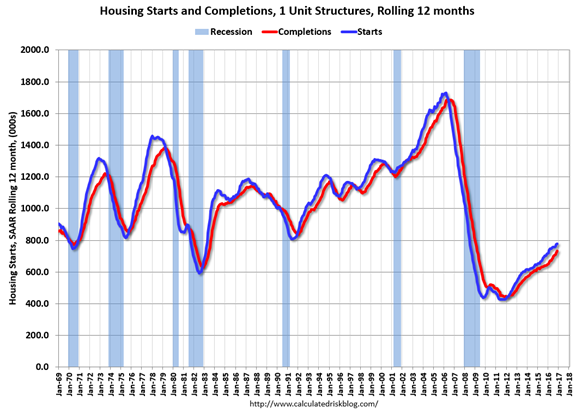
- Housing starts dropped by 18.7%. This was a very bad headline number. Various sources suggest that it emphasizes multi-family while single-family is strong. This is a shift that is quite acceptable, so we should follow it closely. Calculated Risk, our go-to source on all things housing, has a great analysis and this chart.
The Ugly
The Young.
Colleges are profiting from helping credit card companies. The choices are frequently worse than the student could find otherwise.
The Old.
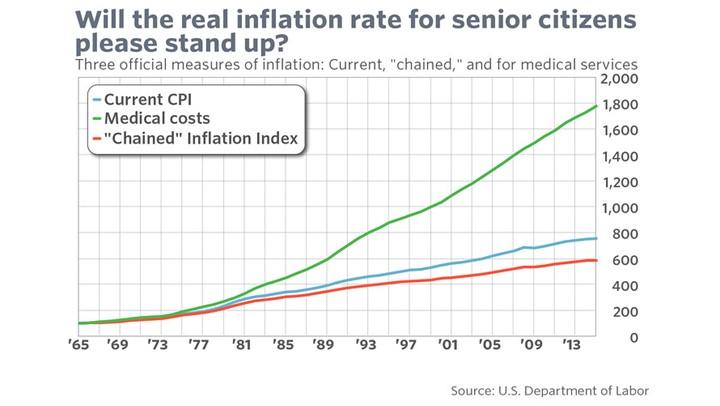
Brett Arends opines that cost-of-living adjustments may soon end. Already the inflation rate for seniors, mostly because of medical costs, exceeds the standard CPI calculation.
The Silver Bullet
I occasionally give the Silver Bullet award to someone who takes up an unpopular or thankless cause, doing the real work to demonstrate the facts. No award this week, but opportunities abound and nominations are welcome!
The Week Ahead
We would all like to know the direction of the market in advance. Good luck with that! Second best is planning what to look for and how to react. That is the purpose of considering possible themes for the week ahead. You can make your own predictions in the comments.
Support My gofundme Campaign - click below
The Calendar
We have a normal week for data, loaded into the latter part of the week. Things will get very quiet after Friday's opening.
The "A" List
- Michigan sentiment (F). Confidence is important right now. Will the mid-month preliminary high hold up?
- New home sales. Not much change expected in this important sector.
- Leading indicators (Th). This widely followed measure is likely to be flat.
- Personal income and spending (Th). This important read on the economy is expected to show solid growth.
- Initial claims (Th). The best concurrent indicator for employment trends.
The "B" List
- Existing home sales (W). A small decline is expected. Less important than new construction, but still relevant.
- PCE price index (Th). The Fed's favorite inflation indicator - still very tame at a touch over 1%.
- Q3 GDP third estimate (Th). Little change expected in what is now viewed as "old news."
- Durable goods orders (Th). This volatile series is expected to be much weaker than the October data.
- Crude inventories. Recently showing even more impact on oil prices. Rightly or wrongly, that spills over to stocks.
Despite the end of the FOMC quiet period, we have little FedSpeak. Chair Yellen makes an early-week appearance, and that is all I see.
Next Week's Theme
Last week attention focused on Dow 20K. This was true even though it is a rather meaningless round number in a flawed index. It shows the power of symbolism to attract attention. When the rally fizzled out, the story swiftly turned. Everyone questions rapid, short-term moves, so it is a natural for the punditry.
I expect it to carry over into a quiet week, with plenty of focus on 2017. The popular question will be about what could stop the rally. What should we worry about? It is time to rebuild the wall or worry.
What could go wrong?
Pundits were already hard at work last week:
You should
ignore the lists or 2017 winners.
Trump's policies might not get enacted, disappointing markets.
S&P businesses are in line for $871 billion.
Trump might make a bad decision in a crisis. An ill-timed tweet?
Or maybe we should look at the bright side?
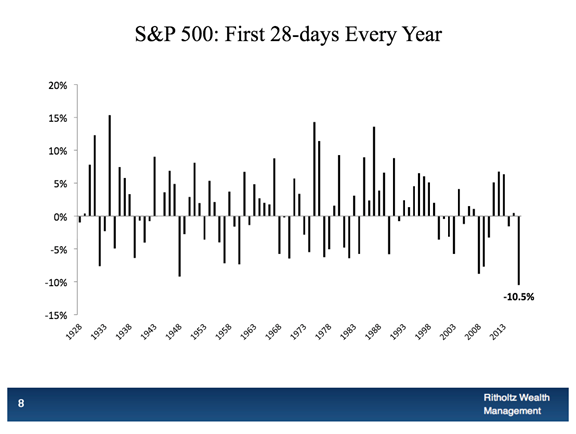
A nice reversal from the negativity of last January, the worst start to a year ever. (
Josh Brown).
The rally is real.
Brian Wesbury's valuation model showed stocks as 30% under-valued on election day.
20% upside for next year?
Brian Gilmartin sticks to the facts. This is an earnings-based conclusion.
What should investors conclude from these sharply conflicting ideas? As usual, I'll have a few ideas of my own in today's "Final Thoughts".
Quant Corner
We follow some regular great sources and the best insights from each week.
Risk Analysis
Whether you are a trader or an investor, you need to understand risk. Think first about your risk. Only then should you consider possible rewards. I monitor many quantitative reports and highlight the best methods in this weekly update.


 LPL Financial