Summary
Dollar cost averaging is a common practice and since the stock is cheaper when it was purchased originally, it has a wider margin of safety.
OHI has pulled back due to its exposure with Genesis Healthcare, the largest tenant.
I see no reason to believe that OHI has become a riskier REIT, instead, I believe OHI is a much safer REIT today.
The Oxford English Dictionary defines "doubling down" as "doubling the wager in exchange for only one additional card in Blackjack" and because of the gambling connotation, "doubling down" suggests riskier behavior.
Before I commence my "double down" pitch, let me remind you that we're not in a casino and it's not my intent to put you in a dangerous situation. In fact, the purpose of my article is to help you mitigate risk so that you will not be exposed to doubling down your retirement money on overly aggressive investments.
In essence, I am suggesting a dollar cost averaging strategy that is simply a system of averaging to lower the cost of stock that has declined after buying shares initially. Dollar cost averaging is a common practice and since the stock is cheaper when it was purchased originally, it has a wider margin of safety.

Omega Healthcare Goes On Sale
Yesterday, Mr. Market put a winter chill on healthcare REITs, likely because of negative expectations regarding HCP Inc.'s (NYSE:HCP) earnings results today. However, Omega Healthcare Investors (NYSE:OHI) also felt the winter chill as shares slid by over 5% in one day of trading.
OHI has been the 5th worst performing healthcare REIT over the last 12 months, largely due to the concerns over weaker profits from assisted living operators.
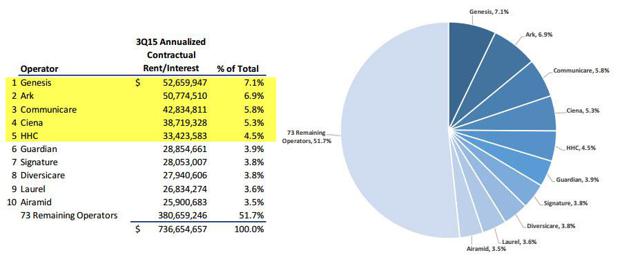
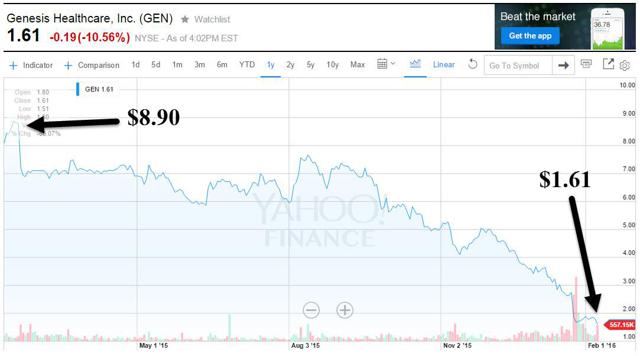
More recently, OHI has pulled back due to its exposure with Genesis Healthcare (NYSE:GEN), the largest tenant.
OHI is not the only REIT with exposure to Genesis; Welltower (NYSE:HCN) has around 13.5% exposure (based on NOI) and Ventas (NYSE:VTR) has around 1.9% exposure (to Genesis). Arguably, the reaction to Genesis' latest earnings results as the catalyst for the sentiment shift related to OHI; however, the $5 million miss (in Q4) seems to be more of a "knee-jerk" reaction given the fact that Genesis generates over $5 billion in revenue.
Genesis also said it had approximately $6 million of higher bad debt expense, principally associated with the former Skilled Healthcare facilities, which coincides with system conversions and operational integration activities that began in the summer of 2015.
Overall, I see no reason to believe that OHI's revenue generated from Genesis will diminish as the company's #1 tenant has maintained a more efficient strategy where cash flows should have little (if any) impact on OHI's overall profitability. Yet, sometimes a knee-jerk reaction can coincide with opportunity... let me explain…
A Pattern of Predictable Performance
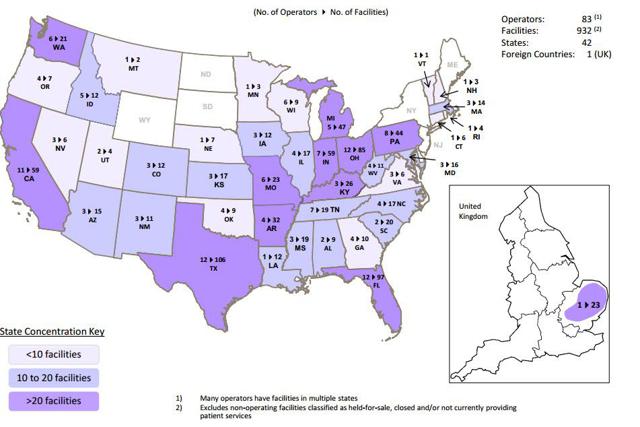
Omega is the largest Skilled Nursing Facility (or SNF)-focused REIT with a portfolio consisting of 932 operating facilities in 42 states and the UK, operated by 83 third-party operators.
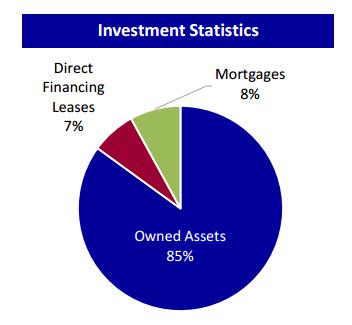
OHI's gross real estate investments total approximately $8.0B and the company's primary focus is on leasing long-term care facilities (primarily skilled nursing facilities) to strong regional and local operators. OHI has long-term triple-net master leases with cross collateralization provisions and most operators have strong credit profiles (with security deposits of three to six months). Around 90% of the portfolio is skilled nursing and around 10% is senior housing.
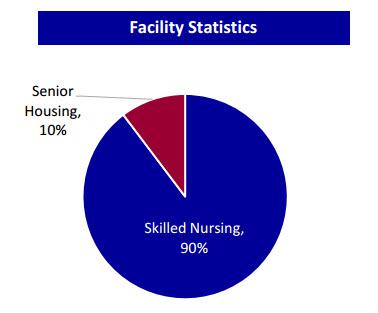
Since the lease are triple net, property level expenses are operator's responsibility (labor, insurance, property taxes, capital expenditures). OHI receives fixed rent payments from tenants, with annual escalators, and operators receive revenues through reimbursement of Medicare, Medicaid and private pay for services.
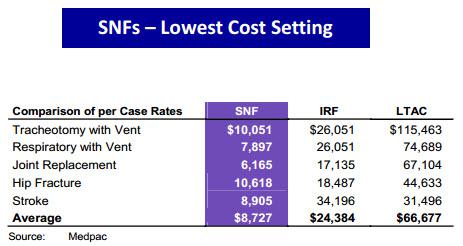
As noted above, Genesis has been focused on streamlining its business model and that is the trend for most skilled nursing operators. This low cost model has created growing demand and limited new supply. As evidenced by the snapshot below, payors remain focused on driving seniors to skilled nursing facilities, the lowest cost setting of care.
Payors focused on driving seniors to skilled nursing facilities are the lowest cost setting of care. Accordingly, this comprehensive delivery of post-acute care generates strong demand for lower costs than alternative inpatient settings. Skilled nursing facilities typically employ lower costs and less staff than long-term acute care hospitals and inpatient rehabilitation facilities - significantly less physical plant requirements, and efficiently designed to deliver care.
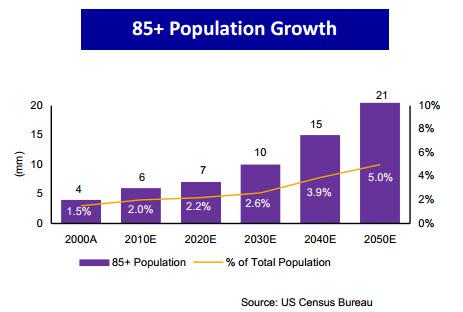
As illustrated below, demand is enhanced within the 85+ an older population:
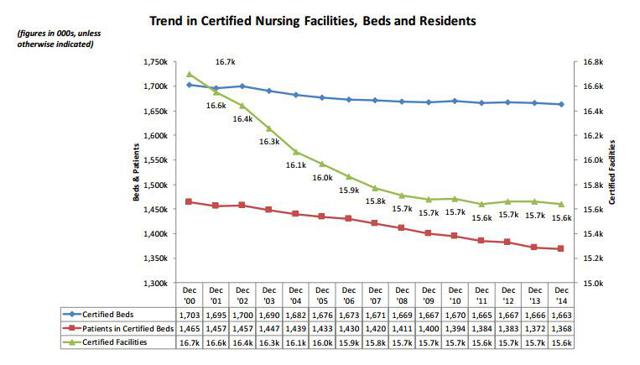
While certified beds and patient occupancy rates remain relatively stable, the number of skilled nursing facilities has trended downward.
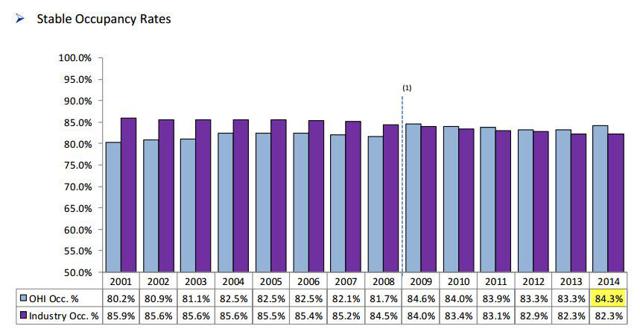
OHI has achieved the highest occupancy rates since 2009:
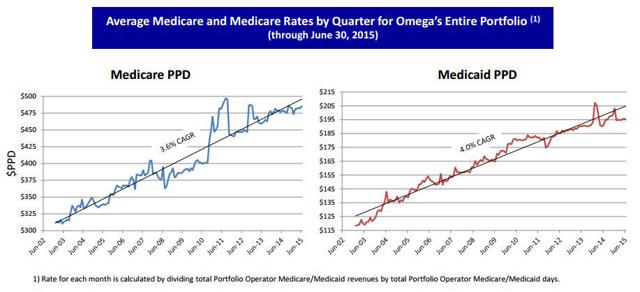
Although reimbursement risk remains a concern, it appears that the government pay model is stable, as evidenced by the strong commitment to funding both Medicare and Medicaid programs for skilled nursing facilities. Medicare and Medicaid expenditures for SNFs are expected to grow 84% from 2011 to 2021. Medicare rates increased 1.2% on October 1, 2015.
Medicaid rates are expected to increase modestly, and dual eligible integrated managed care plans are being initiated by some states.
Most of the DOJ issues have been reported within the higher profile operators. To date, I have not heard of any smaller SNF operators being targeted, and these small and mid-sized operators seem to be hands-on with lower exposure to billing-related issues.
Overall, I view the SNF sector as a highly-desirable category, and recognizing the risks (government pay and billing issues), I maintain a tactical approach with a focus on the REIT's underlying operating fundamentals.
An Improved Balance Sheet, Deserving Of A Credit Upgrade
As evidenced by the snapshot below, OHI has investment grade ratings from all three major rating agencies:

The last credit upgrade was in September 2015 when S&P upgraded OHI from BB+ to BBB- with a stable outlook.
The improved rating reflects the OHI's seamless integration of its merger with Aviv REIT, its improved competitive position and bigger scale and tenant diversification." S&P credit analyst Michael Souers said in a note.
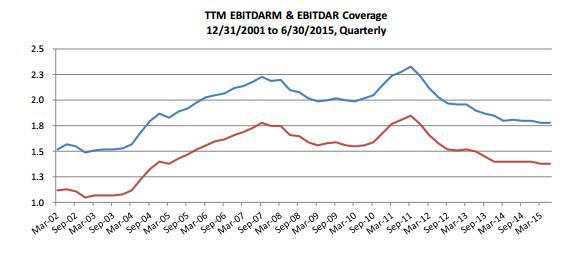
The ratings also took into account the company's progress in improving its balance sheet and decreasing leverage. The stable outlook reflects Omega's stable cash flows from its triple-net leased properties.
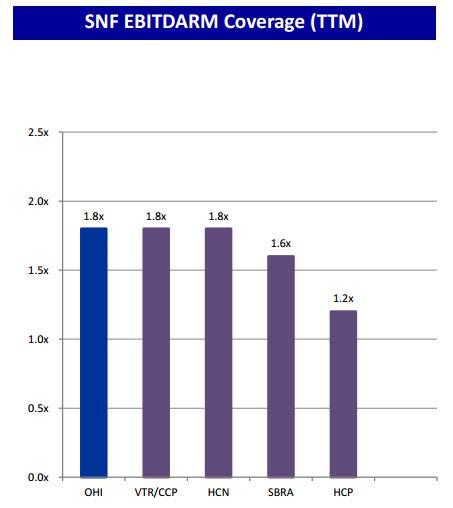
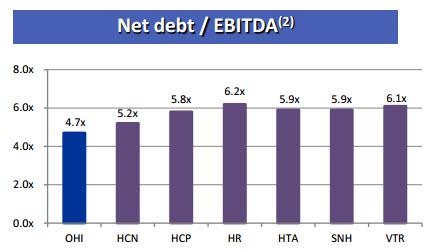
The rating agency predicts that OHI's tenant-level rent coverage will stay flat in a generally unchanged reimbursement environment. Further, it is expected that OHI's credit metrics will modestly improve in 2016, supported by full-year EBITDA contribution from the Aviv merger, with debt to EBITDA declining to the high-4x range.
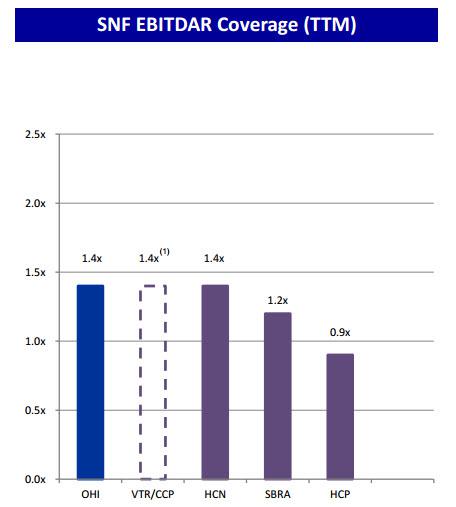
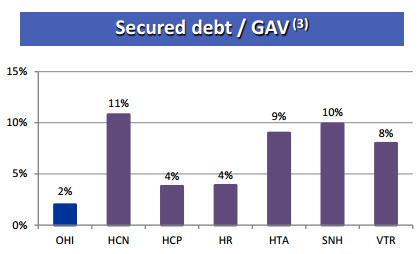
In my opinion, OHI's balance sheet appears to reflect a "BBB" rating given its stronger risk management profile, specifically the reduced exposure to secured borrowing.
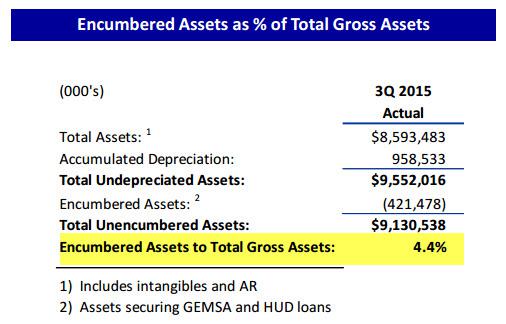
I'm sure that S&P is maintaining more cautious sentiment given OHI's exposure to tenants with higher government reimbursement risk. However, I am encouraged by OHI's strong liquidity profile - around $1.25 billion in full liquidity (firepower for 6 to 8 months of acquisitions). Back in December, OHI obtained a $250 million term loan and last week another $350 million.
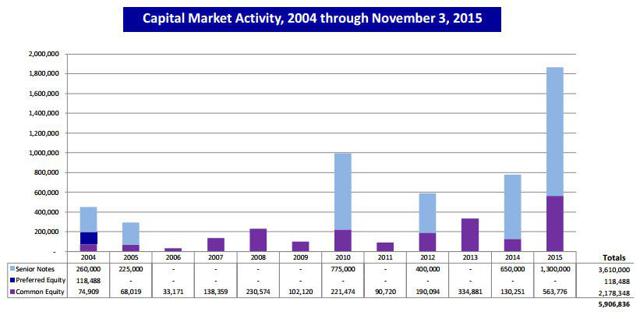
As standard operating procedure, OHI generally uses proceeds from borrowings under the facilities to finance acquisitions and later term out debt on a permanent basis. It's quite clear that this REIT is not capital constrained whatsoever.
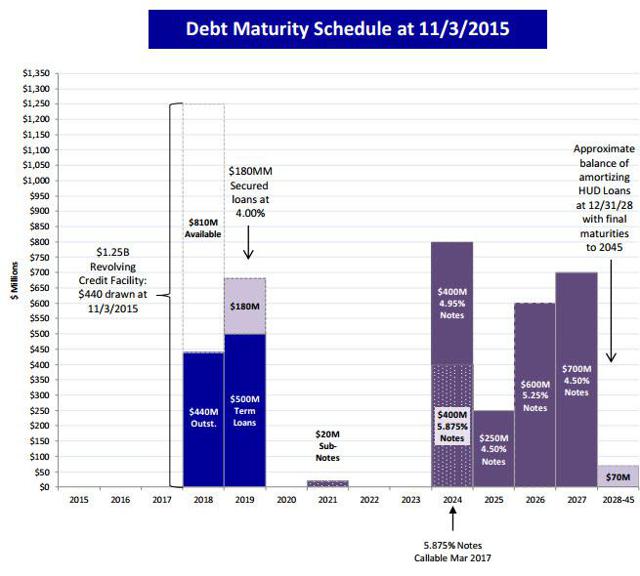
Debt maturities are well balanced with no near-term bond maturities.
Here's a snapshot of net debt/EBITDA compared with the peer group:
Here's a snapshot of secured debt/gross asset value compared with the peer group:
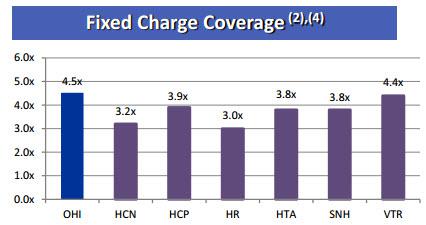
Here's a snapshot of fixed charge coverage compared with the peer group:
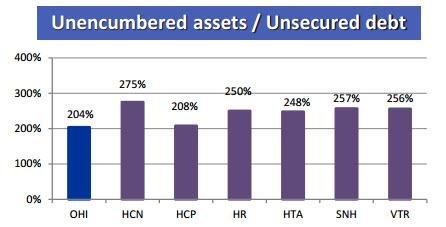
Here's a snapshot of unencumbered assets compared with the peer group:
Why The Double Down Then?
OHI reports Q4-15 earnings later this week (on the 10th). As you may recall, the company increased its 2015 AFFO guidance upward to $3.06 to $3.07 per share (see my last article), and that provides a good barometer that the company should continue to generate robust dividend growth in 2016.
Also, the improved diversification (post Aviv) should reduce risk (governmental) and provide enhanced safety to OHI's prized dividend record. Regardless of the pullback we have seen with OHI's share price, I have not detected a "boogie man" event that causes me to be alarmed. In Q3-15, OHI's AFFO (or adjusted FFO) was $0.79 per share, adjusted funds available for distribution (or FAD) for the quarter was $0.72 per share.
In mid-January, OHI declared a quarterly dividend of $.57 per share, a 1.8% increase from the previous quarterly dividend of $.56 per share. OHI's dividend has been increased by $.01 per share in each of the last 14 quarters.
But it's not just the consistency of OHI's dividend increases, but the size of them. Here's a snapshot of OHI's recent dividend history:
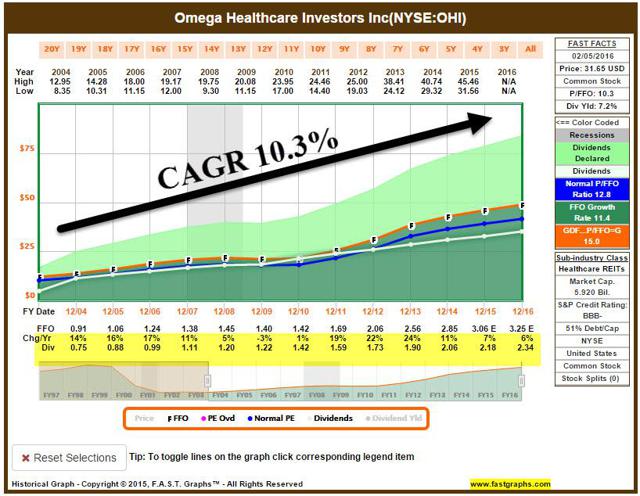
Here's a snapshot of annual dividend growth since 2004:
What's interesting though is that OHI has reduced its FAD payout ratio; it's now less than 80% - indicating that the company has a lot more room to grow (its dividend). In other words, OHI is growing earnings at a faster clip than its dividend, so I would not be surprised to see the company accelerate its $.01 per quarter pattern. Remember the mantra:
the safest dividend is the one that's just been raised.
The Aviv merger has resulted in accretive earnings, and OHI has maintained a disciplined approach without sacrificing (increasing) leverage. OHI's cost of capital is a tad higher today due to the company's share price; however, the continued focus on delivering predictable earnings and dividend growth remains the company's primary competitive advantage.
But is the "wide moat" reflected in the current share price?
Based on the chart below, I don't think so. OHI's dividend yield is now 7.6%, but as you can see, the only peer with a BBB- (or above) credit rating that offers a yield above OHI is SNH.
Conversely, OHI's P/FFO multiple is 11.7x.
Again, comparing the peers with BBB- (or above) credit ratings, HCP and SNH are cheaper than OHI. That tells me that OHI is truly cheap (the dark green shaded REITs have BBB+ or higher credit ratings).
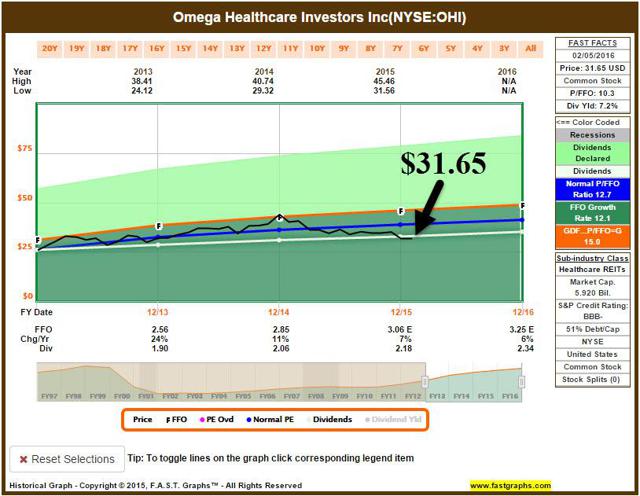
Let's take a longer-term snapshot to see how OHI has performed over the last 3 years:
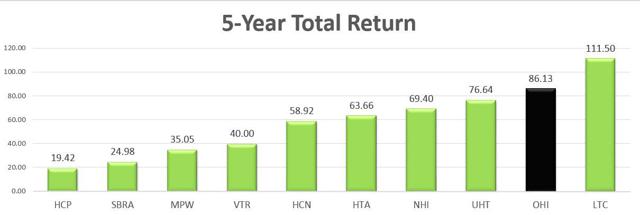
Now let's compare OHI with the peers over the last 5 years:
The bottom line: OHI is one of the simplest REITs that I research - the company acquires healthcare assets at cap rates of 7.5%+ with a cost of capital of around 6.5%. On average, OHI generates spreads of around 150 bps and as the company continues to grow, it reduces its reliance on one operator (i.e. Genesis).
In regards to Genesis, there is really no catalyst that should change this operator's cash flows as the slow drift to efficiency has been a thesis for quite some time. In other words, I see no reason to believe that OHI has become a riskier REIT, instead, I believe OHI is a much safer REIT today (due to the Aviv integration, dividend boost, and reduced payout ratio).
The Dealer Is Napping: If you don't already own OHI, consider buying… and if you already own OHI, it may be time to double down - the cards are stacked in your favor!

Author's Note: I'm a Wall Street writer, and that means that I am not always right with my predictions or recommendations. That also applies to my grammar. Please excuse any typos, and I assure you that I will do my best to correct any errors if they are overlooked.
Finally, this article is free, and my sole purpose for writing it is to assist with my research (I am the editor of a newsletter, Forbes Real Estate Investor), while also providing a forum for second-level thinking. If you have not followed me, please take 5 seconds and click my name above (top of the page).
The only guarantee that I will give you is that I will uncover each and every rock I can in an effort to find satisfactory investments that "upon thorough analysis promises safety of principal and satisfactory return. Operations not meeting these requirements are speculative." (Ben Graham)
Disclaimer: This article is intended to provide information to interested parties. As I have no knowledge of individual investor circumstances, goals, and/or portfolio concentration or diversification, readers are expected to complete their own due diligence before purchasing any stocks mentioned or recommended.
Sources: SNL Financial, FAST Graphs, and OHI Investor Presentation.
Disclosure: I am/we are long O, DLR, VTR, HTA , STAG, GPT, ROIC, HCN, OHI, LXP, KIM, WPC, DOC, EXR, MYCC, BX, TCO, SKT, UBA, STWD, CONE, BRX, CLDT, HST, APTS, FPI, CORR, NHI, CCP, WSR, CTRE, WPG, KRG, SNR, LADR, HCN, HCP, BRX.
By Brad Thomas
Source:http://seekingalpha.com/article/3876836-time-double-omega-healthcare




No comments:
Post a Comment