Apple shares trade at highest prices of 2016 amid Samsung woes

Apple shares trade at highest prices of 2016 amid Samsung woes
Apple Chief Executive Tim Cook was already crowing about users switching from Android to Apple before Samsung’s Note 7 issues.
Shares of Apple Inc. hit their highest prices of 2016 on Tuesday as Samsung Electronics Co. Ltd.’s exploding-phone saga worsened and one analyst said Apple could sell millions of iPhones because of it.
Samsung 005930, -8.04% announced Monday afternoon that any Galaxy Note 7 devices that have been sold should be turned off, and said it was halting sales of the smartphone after replacements suffered a similar overheating issue to the original devices. Samsung had already decided to stop production of its Note 7 smartphone after several more phones caught fire over the weekend, telling MarketWatch that it was “temporarily adjusting the Galaxy Note 7 production schedule in order to take further steps to ensure quality and safety manners.” It took that a step further on Tuesday morning, announcing that it has decided to stop production altogether “for the benefit of consumers’ safety.”
The company issued a global recall of the phone in early September, roughly a month after introducing it, due to a number of incidents in which the phone unexpectedly exploded. Samsung replaced the first batch of phones with new ones, but the problem has seemingly persisted even in replacement models, including last week when one of the newly-issued phones caught fire on a Southwest Airlines plane.
The saga might be a boon to iPhone sales in an otherwise slower-than-normal year for Apple AAPL, +0.03% In a Monday note to clients issued before Samsung completely halted sales, CFRA Research analyst Angelo Zino said he expects the Note 7 issues to help drive some Android users over to iOS, which he estimates could help increase Apple’s share of the global smartphone market by 1%. Samsung had a 22.4% share of the market in the second quarter, double Apple’s share, which was 11.8%, according to industry tracker IDC.
Zino said a 1% share gain would help Apple sell an additional 14 million to 15 million units during the September quarter, which would mean a 7% increase from the analyst’s previous sales forecast. Analysts on average are calling for September-quarter iPhone sales of 45 million, down from 48 million a year ago, according to FactSet. Apple’s iPhone revenues are forecast to come in around $27.6 billion, compared with $32.2 billion in the year-earlier period. However, that could be higher if Zino’s prediction comes true regarding the increasing rate of switchers and share gains.
“The biggest U.S. carriers have also stopped selling Note 7 phones and will allow customers to replace with a different device,” he said. “We see a more favorable competitive landscape and higher Android switcher rates for Apple over the next 12-18 months.”
Zino also expects the Note 7 to dampen future Samsung product launches.
Customers switching to iOS from Alphabet Inc.’s GOOGL, -0.56% GOOG, -0.37% Android operating system represent an opportunity for Apple to drive top-line revenue despite iPhone saturation in developed markets, which has caused Apple’s smartphone sales to dip the past two consecutive quarters. Analysts are anticipating Apple’s first-ever year-over-year annual decline in iPhone sales this year, with the current FactSet consensus calling for 211 million iPhones sold, compared with 231 million last year.
However, switchers accounted for the highest percentage of quarterly iPhone salesin the company’s history last quarter, Apple said, helping it to narrowly surpass quarterly revenue expectations for the June quarter. The company’s next earnings report, which will include September sales of the iPhone, will be released on Oct. 25.
“Switchers and first-time smartphone buyers represented the lion’s share of our iPhone sales in the quarter,” Apple CEO Tim Cook said on a call with analysts in July.
Shares of Apple rose 1.7% to close Monday at a 10-month high of $116.05, pushing them up 20% in the past three months. They have vastly outperformed the Dow Jones Industrial Average DJIA, -1.09% which includes Apple, as the blue-chip index is up less than 1% in that time period.
By Jennifer Booton
This Hot Stock Shows Why 10 Billionaires Can't All Be Wrong
If you think solar energy is only embraced by the sort of people who vote for Sen. Bernie Sanders (D., Vt.), a self-avowed socialist, consider this: Ten billionaires are investing massive sums in renewable energy technologies such as solar. Warren Buffett, George Soros, Bill Gates and their super-wealthy peers can hardly be considered as naïve and utopian.
 Below, we examine a solar stock with the greatest growth potential this year. It's poised for triple-digit gains in 2016, no mean feat in a market that some analysts are saying will soon descend into a prolonged slump. If you want to "beat the bear," you should look for companies with game-changing technologies that are tapped into unstoppable trends.
But there's another misconception about solar right now. Many investors think that persistently low oil and gas prices will compel end users to abandon solar in favor of cheaper fossil fuels.
If you believe that fallacy, you'll miss one of the most exciting investment opportunities to come along in decades. Fact is, the infrastructure for the solar industry is now pervasive and entrenched, leading to a "price decoupling" of solar and fossil fuels. Solar and other renewable energies are now integral to the energy status quo and no longer need high oil and gas prices to attract users.
That's why the stock we examine below is projected to appreciate by as much as 193% this year. For further explanation as to the dynamics behind this company's stunning rise, let's turn to the Gartner Hype Cycle.
The Hype Cycle is a graphical presentation developed and used by technology research and advisory firm Gartner for representing the maturity, adoption and social application of specific technologies.
Each Hype Cycle describes five crucial phases of a technology's life cycle:
1) Technology Trigger: A technology breakthrough kicks things off; excitement builds.
2) Peak of Inflated Expectations: Early publicity spawns a flurry of success (and failure) stories. Some companies adapt; others fall by the wayside.
3) Trough of Disillusionment: Interest diminishes as reality fails to live up to the hype. A shakeout ensues, but the smartest early adopters survive and continue to invest and experiment.
4) Slope of Enlightenment: The technology becomes better understood and implemented. Second- and third-generation products emerge.
5) Plateau of Productivity: Mainstream adoption takes off.
Simply put, solar has already passed through its "hype" period and is now in the "plateau of productivity" for sustainable, long-term growth.
The solar industry has not seen its fortunes diminish in the face of cheaper fossil fuels, because solar now moves along its own supply-and-demand dynamics within its plateau of productivity. It doesn't matter if oil is dirt-cheap right now. Solar's customers are increasingly dependent on inexpensive, reliable power from the sun and see no rationale for switching.
The one stock that appears to have greatest upside potential this year is Canadian Solar (CSIQ - Get Report) .
Below, we examine a solar stock with the greatest growth potential this year. It's poised for triple-digit gains in 2016, no mean feat in a market that some analysts are saying will soon descend into a prolonged slump. If you want to "beat the bear," you should look for companies with game-changing technologies that are tapped into unstoppable trends.
But there's another misconception about solar right now. Many investors think that persistently low oil and gas prices will compel end users to abandon solar in favor of cheaper fossil fuels.
If you believe that fallacy, you'll miss one of the most exciting investment opportunities to come along in decades. Fact is, the infrastructure for the solar industry is now pervasive and entrenched, leading to a "price decoupling" of solar and fossil fuels. Solar and other renewable energies are now integral to the energy status quo and no longer need high oil and gas prices to attract users.
That's why the stock we examine below is projected to appreciate by as much as 193% this year. For further explanation as to the dynamics behind this company's stunning rise, let's turn to the Gartner Hype Cycle.
The Hype Cycle is a graphical presentation developed and used by technology research and advisory firm Gartner for representing the maturity, adoption and social application of specific technologies.
Each Hype Cycle describes five crucial phases of a technology's life cycle:
1) Technology Trigger: A technology breakthrough kicks things off; excitement builds.
2) Peak of Inflated Expectations: Early publicity spawns a flurry of success (and failure) stories. Some companies adapt; others fall by the wayside.
3) Trough of Disillusionment: Interest diminishes as reality fails to live up to the hype. A shakeout ensues, but the smartest early adopters survive and continue to invest and experiment.
4) Slope of Enlightenment: The technology becomes better understood and implemented. Second- and third-generation products emerge.
5) Plateau of Productivity: Mainstream adoption takes off.
Simply put, solar has already passed through its "hype" period and is now in the "plateau of productivity" for sustainable, long-term growth.
The solar industry has not seen its fortunes diminish in the face of cheaper fossil fuels, because solar now moves along its own supply-and-demand dynamics within its plateau of productivity. It doesn't matter if oil is dirt-cheap right now. Solar's customers are increasingly dependent on inexpensive, reliable power from the sun and see no rationale for switching.
The one stock that appears to have greatest upside potential this year is Canadian Solar (CSIQ - Get Report) .

 With a market cap of $917.27 billion, Canadian Solar produces solar ingots, wafers, cells, modules and integrated power systems. Canadian Solar is a "small-cap rocket stock" that is poised to explode this year. As a small-cap with current market capitalization of about $1.07 billion, Canadian Solar confers greater risk than peers First Solar (FSLR - Get Report) (market cap: $6.3 billion) and SunPower (SPWR - Get Report) (market cap: $3.3 billion), but it also enjoys the greatest upside potential.
By John Persinos
Below, we examine a solar stock with the greatest growth potential this year. It's poised for triple-digit gains in 2016, no mean feat in a market that some analysts are saying will soon descend into a prolonged slump. If you want to "beat the bear," you should look for companies with game-changing technologies that are tapped into unstoppable trends.The 5 Most Important 2016 IPOs to Watch
It's going to be a volatile year for the market, as the Dow Jones has had its worst start to the year in history. The index fell 8.3% in the first 10 trading days.
Market volatility means less demand for newly issued stocks – which will hurt2016 IPOs. That's what hurt the IPO market in 2015. The Dow's 6.6% plunge in August scared off private companies planning to go public and caused 17 IPO withdrawals during the third quarter – the most for that quarter since 2012.
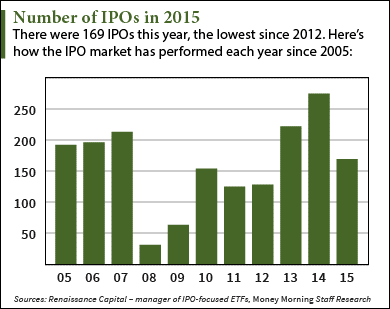 Compared to 2014's blockbuster year, the overall 2015 IPO market was a huge disappointment for investors. Only 169 companies went public last year and raised a combined $30 billion in proceeds. That's the lowest amount of annual IPO proceeds since 2009.
The tech sector, which was the crown jewel of the 2014 IPO market, underperformed in 2015. Tech IPOs only raised a combined $4.2 billion in 2015. Tech deals raised $32.3 billion in 2014; the Alibaba Group Holding Ltd. (NYSE: BABA) IPO from September 2014 raised $21.8 billion alone.
While about 58% of 2015's IPOs trade below their offer price, a number of new stocks profited through the volatility. Popular companies like GoDaddy Inc. (NYSE: GDDY) and Shake Shack Inc. (NYSE: SHAK) are up 46% and 52.7% from their respective IPO prices last year.
Just like last year, not all of 2016's new issues will flop. That's why we're tracking these five major 2016 IPOs. Even if the markets are volatile, these new issues all have the chance to reward investors and outperform the markets in 2016…
Compared to 2014's blockbuster year, the overall 2015 IPO market was a huge disappointment for investors. Only 169 companies went public last year and raised a combined $30 billion in proceeds. That's the lowest amount of annual IPO proceeds since 2009.
The tech sector, which was the crown jewel of the 2014 IPO market, underperformed in 2015. Tech IPOs only raised a combined $4.2 billion in 2015. Tech deals raised $32.3 billion in 2014; the Alibaba Group Holding Ltd. (NYSE: BABA) IPO from September 2014 raised $21.8 billion alone.
While about 58% of 2015's IPOs trade below their offer price, a number of new stocks profited through the volatility. Popular companies like GoDaddy Inc. (NYSE: GDDY) and Shake Shack Inc. (NYSE: SHAK) are up 46% and 52.7% from their respective IPO prices last year.
Just like last year, not all of 2016's new issues will flop. That's why we're tracking these five major 2016 IPOs. Even if the markets are volatile, these new issues all have the chance to reward investors and outperform the markets in 2016…
It's going to be a volatile year for the market, as the Dow Jones has had its worst start to the year in history. The index fell 8.3% in the first 10 trading days.
Market volatility means less demand for newly issued stocks – which will hurt2016 IPOs. That's what hurt the IPO market in 2015. The Dow's 6.6% plunge in August scared off private companies planning to go public and caused 17 IPO withdrawals during the third quarter – the most for that quarter since 2012.
Compared to 2014's blockbuster year, the overall 2015 IPO market was a huge disappointment for investors. Only 169 companies went public last year and raised a combined $30 billion in proceeds. That's the lowest amount of annual IPO proceeds since 2009.
The tech sector, which was the crown jewel of the 2014 IPO market, underperformed in 2015. Tech IPOs only raised a combined $4.2 billion in 2015. Tech deals raised $32.3 billion in 2014; the Alibaba Group Holding Ltd. (NYSE: BABA) IPO from September 2014 raised $21.8 billion alone.
While about 58% of 2015's IPOs trade below their offer price, a number of new stocks profited through the volatility. Popular companies like GoDaddy Inc. (NYSE: GDDY) and Shake Shack Inc. (NYSE: SHAK) are up 46% and 52.7% from their respective IPO prices last year.
Just like last year, not all of 2016's new issues will flop. That's why we're tracking these five major 2016 IPOs. Even if the markets are volatile, these new issues all have the chance to reward investors and outperform the markets in 2016…
2016 IPOs to Watch No. 1: Uber Technologies Inc.
 Although no date has been announced yet, the Uber IPO will be the most anticipated deal of 2016. That's because the company's sky-high valuation is unprecedented when it comes to startups.
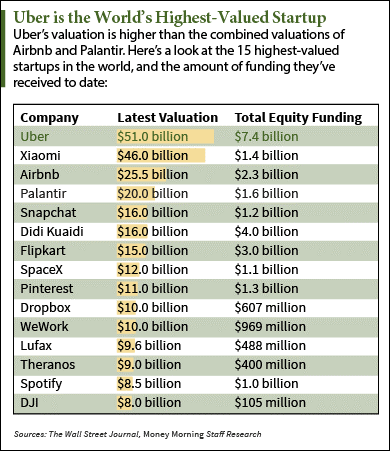
At $51 billion, Uber is the highest-valued private company in the world. The mobile taxi service has raised $7.4 billion over 13 rounds of funding. It's currently seeking $2.1 billion in its latest round, which would value the company at $62.5 billion.
Uber's major appeal to investors is it's disruption of an untouched market. The taxi industry has operated for years with relatively few changes and competitors. Now, Uber offers an easily available third option between hailing a cab and paying exorbitant prices for a private car service.
While the company doesn't release financials, it's expected to hit an annual revenue of $10 billion by the end of 2015. According to a 2014 report by The New York Times, Uber could potentially bring in $1 billion in annual revenue if it successfully takes over 50% of the U.S. taxi industry.
Because it has raised a whopping $7.4 billion in private funding, company officials have been able to put off the Uber IPO until 2016. It's currently in the process of raising $2.1 billion in its 13th financing round.
Although no date has been announced yet, the Uber IPO will be the most anticipated deal of 2016. That's because the company's sky-high valuation is unprecedented when it comes to startups.
At $51 billion, Uber is the highest-valued private company in the world. The mobile taxi service has raised $7.4 billion over 13 rounds of funding. It's currently seeking $2.1 billion in its latest round, which would value the company at $62.5 billion.
Uber's major appeal to investors is it's disruption of an untouched market. The taxi industry has operated for years with relatively few changes and competitors. Now, Uber offers an easily available third option between hailing a cab and paying exorbitant prices for a private car service.
While the company doesn't release financials, it's expected to hit an annual revenue of $10 billion by the end of 2015. According to a 2014 report by The New York Times, Uber could potentially bring in $1 billion in annual revenue if it successfully takes over 50% of the U.S. taxi industry.
Because it has raised a whopping $7.4 billion in private funding, company officials have been able to put off the Uber IPO until 2016. It's currently in the process of raising $2.1 billion in its 13th financing round.
2016 IPOs to Watch No. 2: Pinterest Inc.
The hype behind Pinterest Inc. is simple – it will become the latest major social media website to IPO after Facebook Inc. (Nasdaq: FB) and Twitter Inc. (NYSE:TWTR).
Pinterest is a scrapbooking site where users can manage topical "pins" through collections called "pinboards." Most pinboards focus on fashion, cooking, and child-related activities. The site commands a strong female demographic, with comScore reporting nearly 70% of Pinterest's 100 million monthly users are women.
The company has seen incredibly strong funding growth. Over the company's seven disclosed rounds, its funding has seen an average growth rate of 138% each round. It has raised $1.3 billion in total equity funding and is valued at $11 billion.
But Pinterest is one of many tech companies with an unrealistically high valuation. The only way these firms can keep their valuations from getting slashed is by never actually filing for an IPO.
A recent example is Square Inc. (NYSE: SQ). After the company filed back in October, its valuation became $4.2 billion. That's a significant drop from the $6 billion valuation it received during its last round of funding.
Pinterest is even more susceptible to a valuation cut due to its small revenue stream. The Wall Street Journal reported the company brought in less than $25 million in 2014. The company's valuation is 44 times that amount.
The success of the Pinterest IPO will depend on whether or not investors and issuers are willing to lower their expectations.
2016 IPOs to Watch No. 3: Snapchat Inc.
 In May 2015, Snapchat Inc. CEO Evan Spiegel announced he intends to take his company public. Although he didn't offer many specifics for theSnapchat IPO date, it was the first time any company official mentioned going public.
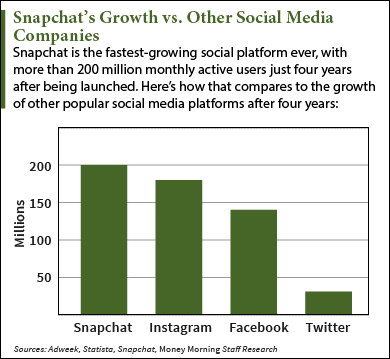
First launched in 2011, Snapchat has since become one of the fastest-growing social media platforms ever. It currently has more than 200 million monthly active users (MAUs). That's 43% more than Facebook's MAUs four years after its launch.
Although Snapchat hasn't turned a profit yet, the company just launched in October a new advertising format that will put it on track for $100 million a year. Called "Sponsored Lenses," it allows users to add different animated filters to pictures or videos of themselves.
These filters give companies an outlet for advertising. For example, 20th Century Fox allowed animated selfie features with characters from the studio's upcoming "The Peanuts Movie." Users could add animated characters like Woodstock and Snoopy to their picture messages.
Snapchat's challenge moving forward will be building these new sources of advertising revenue. Investors will also be looking for it to turn a profit sometime soon, which is the biggest challenge for social media companies before going public.
In May 2015, Snapchat Inc. CEO Evan Spiegel announced he intends to take his company public. Although he didn't offer many specifics for theSnapchat IPO date, it was the first time any company official mentioned going public.
First launched in 2011, Snapchat has since become one of the fastest-growing social media platforms ever. It currently has more than 200 million monthly active users (MAUs). That's 43% more than Facebook's MAUs four years after its launch.
Although Snapchat hasn't turned a profit yet, the company just launched in October a new advertising format that will put it on track for $100 million a year. Called "Sponsored Lenses," it allows users to add different animated filters to pictures or videos of themselves.
These filters give companies an outlet for advertising. For example, 20th Century Fox allowed animated selfie features with characters from the studio's upcoming "The Peanuts Movie." Users could add animated characters like Woodstock and Snoopy to their picture messages.
Snapchat's challenge moving forward will be building these new sources of advertising revenue. Investors will also be looking for it to turn a profit sometime soon, which is the biggest challenge for social media companies before going public.
2016 IPOs to Watch No. 4: Saudi Aramco
Saudi Aramco – the most valuable and secretive company in the world – is considering going public in 2016.
According to a Jan. 6 report by The Economist, a Saudi Aramco IPO is being considered by the kingdom of Saudi Arabia. Formally known as the Saudi Arabian Oil Co., the state-owned oil behemoth known for keeping its revenue and other financials under wraps announced it's going over plans to sell a stake in the company.
Saudi Aramco has dominated the global oil industry for over 70 years. It produces more than 10% of the world's total oil supply every day. In 2014, the company stated it owns 261 billion barrels of crude oil reserves. That dwarfs the 14 billion barrels owned by Exxon Mobil Corp. (NYSE: XOM) – the largest non-state-owned oil company in the world.
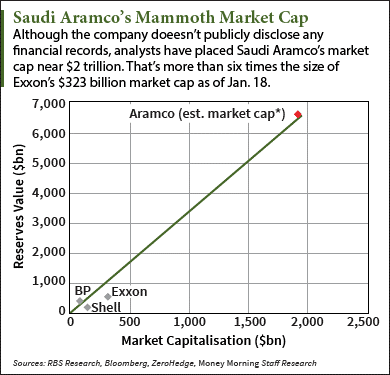 A Saudi Aramco IPO of even a small slice of the company could raise billions of dollars in proceeds. It could also possibly become the largest IPO of all time. After all, analysts from RBS Research and Bloomberg estimate Saudi Aramco would command a $2 trillion market cap after going public. That's about 535% more than Exxon's market cap.
The massive proceeds from the IPO will be used to pay off the Saudi government's mounting budget deficit. Since oil accounts for nearly 80% of the country's total exports, Saudi Arabia reported a fiscal deficit of $98 billion last year due to the 44% drop in oil prices.
With a current budget deficit of roughly $87 billion, the Saudi government is desperate to climb out of its hole of debt. Selling a stake of its crown jewel to the public is an easy way to infuse money into the country's struggling economy.
A Saudi Aramco IPO of even a small slice of the company could raise billions of dollars in proceeds. It could also possibly become the largest IPO of all time. After all, analysts from RBS Research and Bloomberg estimate Saudi Aramco would command a $2 trillion market cap after going public. That's about 535% more than Exxon's market cap.
The massive proceeds from the IPO will be used to pay off the Saudi government's mounting budget deficit. Since oil accounts for nearly 80% of the country's total exports, Saudi Arabia reported a fiscal deficit of $98 billion last year due to the 44% drop in oil prices.
With a current budget deficit of roughly $87 billion, the Saudi government is desperate to climb out of its hole of debt. Selling a stake of its crown jewel to the public is an easy way to infuse money into the country's struggling economy.
Saudi Aramco – the most valuable and secretive company in the world – is considering going public in 2016.
According to a Jan. 6 report by The Economist, a Saudi Aramco IPO is being considered by the kingdom of Saudi Arabia. Formally known as the Saudi Arabian Oil Co., the state-owned oil behemoth known for keeping its revenue and other financials under wraps announced it's going over plans to sell a stake in the company.
Saudi Aramco has dominated the global oil industry for over 70 years. It produces more than 10% of the world's total oil supply every day. In 2014, the company stated it owns 261 billion barrels of crude oil reserves. That dwarfs the 14 billion barrels owned by Exxon Mobil Corp. (NYSE: XOM) – the largest non-state-owned oil company in the world.
A Saudi Aramco IPO of even a small slice of the company could raise billions of dollars in proceeds. It could also possibly become the largest IPO of all time. After all, analysts from RBS Research and Bloomberg estimate Saudi Aramco would command a $2 trillion market cap after going public. That's about 535% more than Exxon's market cap.
The massive proceeds from the IPO will be used to pay off the Saudi government's mounting budget deficit. Since oil accounts for nearly 80% of the country's total exports, Saudi Arabia reported a fiscal deficit of $98 billion last year due to the 44% drop in oil prices.
With a current budget deficit of roughly $87 billion, the Saudi government is desperate to climb out of its hole of debt. Selling a stake of its crown jewel to the public is an easy way to infuse money into the country's struggling economy.
2016 IPOs to Watch No. 5: Xiaomi Inc.
Its name may not resonate in the United States, but Xiaomi Inc. is known around the world as the "Apple of China." That's because it's the third-largest provider of smartphones in the world behind Apple Inc. (Nasdaq: AAPL) and Samsung.
But the Chinese smartphone giant has had a rough year as it struggles to meet sales expectations.
After selling 60 million phones in 2014, Xiaomi vowed to sell 100 million phones last year. In March, CEO Lei Jun lowered that projection to 80 million. The company reported in July that it had only sold 34.7 million phones in the first half of 2015. According to research firm Trendforce, the company was on track to sell only 70 million phones in 2015.
There's also a question about Xiaomi's profitability. The company sells many of its devices near their break-even point, or cost of production. The average device sold by Xiaomi retails at about $150. Apple's iPhones retail for as much as $600 each in the United States.
The company plans to go public sometime in 2016, but no official Xiaomi IPO date has been set yet. While the size of the deal is unknown, the company is valued at $46 billion.
Although few Americans know about Xiaomi, a U.S. IPO would be a big story due to the recent performance of Chinese stocks. Alibaba and Baidu Inc. (Nasdaq ADR: BIDU) – China's largest Internet search company – have gained 22.7% and 32.4% in the last three months, respectively.
A debut of Xiaomi stock in 2016 would be welcomed by investors looking to play the growing Chinese market. It's unclear whether Xiaomi will debut in the United States or China, but the recent success of Chinese companies on U.S. markets could influence that decision.
By Alex Mcguire
HOT PENNY STOCK
Los Angeles, May 20, 2015 (GLOBE NEWSWIRE) -- Giggles N' Hugs, Inc. (GIGL), owner and operator of family-friendly restaurants that bring together high-end, organic food with active, cutting-edge play and entertainment for children, announces its financial results for the thirteen weeks ended March 29, 2015.
First Quarter Highlights:
.
Revenue increased 11.7% year-over-year to $0.9 million
.
Total costs and operating expenses decreased 6.9% year-over-year
.
Total long-term liabilities were $1.7 million at quarter end, down 3.8% from year-end 2014
 "This is the first quarter we're seeing true year-over-year comparisons for our three current locations, and to report double-digit revenue growth in the period bodes very well for our long-term success," commented Joey Parsi, founder and CEO of Giggles N' Hugs. "We also took important steps to prepare for our expansion by further strengthening our management team with the addition of Philip Gay as chief business development officer and John Kaufman as interim-president. Having worked together previously in their roles as CFO and COO respectively at California Pizza Kitchen, where they helped grow the chain from two locations to more than 70 locations, Gay and Kaufman are incredible additions to our team and provide a strong endorsement of our concept as we move into the next phase of our expansion."
Parsi continued, "With the help of Todd Star, the former head of west coast leasing at Westfield USA, who is now spearheading our negotiations with all the major mall owners in the country, we're moving forward on our goal of expanding to 12 company-owned locations by the end of 2017. We're also very excited about the potential of further growth fueled by franchise locations. Since opening our first Giggles N' Hugs in 2009, we've seen a steady stream of interest from franchisees looking to take our concept to markets here in the U.S. and around the world. We look forward to reporting on our progress on these and other fronts in the coming quarters as we work diligently to generate continued shareholder value improvements."
The net sales for the thirteen weeks ended March 29, 2015 and March 30, 2014 were $918,228 and $822,050, respectively. The increase of $96,178, or 11.7%, was due primarily to a continuing trend for higher party rentals. The net sales consist of revenues from food and beverages, private party rentals, fees for access to the children's play area, sales from membership cards (of varying terms), sales from Giggles N' Hugs-branded merchandise, and net of allowances, returns and discounts. Sales were up for private party rentals and other sales, offsetting the decrease in allowances, returns and discounts. The Century City location showed the highest increase of 19.0% over the comparable period from last year.
Costs related to food purchases, supplies and general restaurant operations totaled $214,316 during the thirteen weeks ended March 29, 2015 which showed virtually no change in costs from the comparable period last year. Food costs fluctuate regularly and are difficult to offset or minimize, as any increase in costs of certain commodities could adversely impact the Company's operations unless it passes any such price increases to its guests.
Labor expenses for the thirteen weeks ended March 29, 2015 and March 30, 2014 were $332,071, and $319,518, respectively. The increase of 3.9% was largely due to wage increases. As a customer service company our primary variable cost is related to providing such services. With constant pressure for increased wages, the Company was successfully in keeping labor costs at 39% of revenue versus 38% for a comparable period in 2014. Labor costs are constantly fluctuating and any changes to minimum wages payable could adversely impact the Company's operations.
Adjusted net loss (non-GAAP) for the thirteen weeks ended March 29, 2015 was $120,000. The net loss for the thirteen weeks ended March 29, 2015 was $318,680, compared to a net loss of $506,272 for the thirteen weeks ended March 30, 2014. The decrease of $187,592, or 37%, was a function of stabilizing operating costs and a drop in overall general and administrative costs 37%. Management believe losses will continue to be reduced and profitability will be attained in future quarters as the popularity of its restaurants increases.
About Giggles N' Hugs
Giggles N' Hugs is the first and only restaurant that brings together high-end, organic food with active, cutting-edge play and entertainment for children. Every Giggles N' Hugs location offers an upscale, family-friendly atmosphere with a dedicated play area that children 10 and younger absolutely love. We feature high-quality menus made from fresh and local foods, nightly entertainment such as magic shows, concerts, puppet shows and face painting, and hugely popular party packages for families that want to do something special.
Forward Looking Statements:
Certain statements in this press release constitute "forward-looking statements" within the meaning of the federal securities laws. Words such as "may," "might," "will," "should," "believe," "expect," "anticipate," "estimate," "continue," "predict," "forecast," "project," "plan," "intend" or similar expressions, or statements regarding intent, belief, or current expectations, are forward-looking statements. While the Company believes these forward-looking statements are reasonable, undue reliance should not be placed on any such forward-looking statements, which are based on information available to us on the date of this release. These forward looking statements are based upon current estimates and assumptions and are subject to various risks and uncertainties, including without limitation those set forth in the Company's filings with the Securities and Exchange Commission (the "SEC"). Thus, actual results could be materially different. The Company expressly disclaims any obligation to update or alter statements whether as a result of new information, future events or otherwise, except as required by law.
"This is the first quarter we're seeing true year-over-year comparisons for our three current locations, and to report double-digit revenue growth in the period bodes very well for our long-term success," commented Joey Parsi, founder and CEO of Giggles N' Hugs. "We also took important steps to prepare for our expansion by further strengthening our management team with the addition of Philip Gay as chief business development officer and John Kaufman as interim-president. Having worked together previously in their roles as CFO and COO respectively at California Pizza Kitchen, where they helped grow the chain from two locations to more than 70 locations, Gay and Kaufman are incredible additions to our team and provide a strong endorsement of our concept as we move into the next phase of our expansion."
Parsi continued, "With the help of Todd Star, the former head of west coast leasing at Westfield USA, who is now spearheading our negotiations with all the major mall owners in the country, we're moving forward on our goal of expanding to 12 company-owned locations by the end of 2017. We're also very excited about the potential of further growth fueled by franchise locations. Since opening our first Giggles N' Hugs in 2009, we've seen a steady stream of interest from franchisees looking to take our concept to markets here in the U.S. and around the world. We look forward to reporting on our progress on these and other fronts in the coming quarters as we work diligently to generate continued shareholder value improvements."
The net sales for the thirteen weeks ended March 29, 2015 and March 30, 2014 were $918,228 and $822,050, respectively. The increase of $96,178, or 11.7%, was due primarily to a continuing trend for higher party rentals. The net sales consist of revenues from food and beverages, private party rentals, fees for access to the children's play area, sales from membership cards (of varying terms), sales from Giggles N' Hugs-branded merchandise, and net of allowances, returns and discounts. Sales were up for private party rentals and other sales, offsetting the decrease in allowances, returns and discounts. The Century City location showed the highest increase of 19.0% over the comparable period from last year.
Costs related to food purchases, supplies and general restaurant operations totaled $214,316 during the thirteen weeks ended March 29, 2015 which showed virtually no change in costs from the comparable period last year. Food costs fluctuate regularly and are difficult to offset or minimize, as any increase in costs of certain commodities could adversely impact the Company's operations unless it passes any such price increases to its guests.
Labor expenses for the thirteen weeks ended March 29, 2015 and March 30, 2014 were $332,071, and $319,518, respectively. The increase of 3.9% was largely due to wage increases. As a customer service company our primary variable cost is related to providing such services. With constant pressure for increased wages, the Company was successfully in keeping labor costs at 39% of revenue versus 38% for a comparable period in 2014. Labor costs are constantly fluctuating and any changes to minimum wages payable could adversely impact the Company's operations.
Adjusted net loss (non-GAAP) for the thirteen weeks ended March 29, 2015 was $120,000. The net loss for the thirteen weeks ended March 29, 2015 was $318,680, compared to a net loss of $506,272 for the thirteen weeks ended March 30, 2014. The decrease of $187,592, or 37%, was a function of stabilizing operating costs and a drop in overall general and administrative costs 37%. Management believe losses will continue to be reduced and profitability will be attained in future quarters as the popularity of its restaurants increases.
About Giggles N' Hugs
Giggles N' Hugs is the first and only restaurant that brings together high-end, organic food with active, cutting-edge play and entertainment for children. Every Giggles N' Hugs location offers an upscale, family-friendly atmosphere with a dedicated play area that children 10 and younger absolutely love. We feature high-quality menus made from fresh and local foods, nightly entertainment such as magic shows, concerts, puppet shows and face painting, and hugely popular party packages for families that want to do something special.
Forward Looking Statements:
Certain statements in this press release constitute "forward-looking statements" within the meaning of the federal securities laws. Words such as "may," "might," "will," "should," "believe," "expect," "anticipate," "estimate," "continue," "predict," "forecast," "project," "plan," "intend" or similar expressions, or statements regarding intent, belief, or current expectations, are forward-looking statements. While the Company believes these forward-looking statements are reasonable, undue reliance should not be placed on any such forward-looking statements, which are based on information available to us on the date of this release. These forward looking statements are based upon current estimates and assumptions and are subject to various risks and uncertainties, including without limitation those set forth in the Company's filings with the Securities and Exchange Commission (the "SEC"). Thus, actual results could be materially different. The Company expressly disclaims any obligation to update or alter statements whether as a result of new information, future events or otherwise, except as required by law.
HOT PENNY STOCK
Los Angeles, May 20, 2015 (GLOBE NEWSWIRE) -- Giggles N' Hugs, Inc. (GIGL), owner and operator of family-friendly restaurants that bring together high-end, organic food with active, cutting-edge play and entertainment for children, announces its financial results for the thirteen weeks ended March 29, 2015.
| Adjusted Net Loss (non-GAAP) Reconciliation (in millions) | |||
| 1Q15 | |||
| Net Loss, as reported | ($0.32) | ||
| add back non-cash and non-recurring items: | |||
| Loss on settlement | $0.02 | ||
| Depreciation and amortization | $0.09 | ||
| Share based comp | $0.07 | ||
| Litigation expense, non-recurring | $ | ||
| Finance and interest expense, related to warrant exercise | $0.02 | ||
| Adjusted net loss | ($0.12) | ||
INVESTORS RELATIONS CONTACT:
Bruce Haase?
RedChip Companies, Inc.?
800.733.2447, ext. 131?
bruce@redchip.com
Joey Parsi
Founder/CEO
Giggles N Hugs
Joey@gigglesnhugs.com
Xpel Technologies: Wrapping Up A Sticky Model And Hyper Growth Worth Multiples Of Today's Price
Summary
- Xpel's growth over the past 4 years is on-par with growth of Wal-Mart post IPO and both have many traits in common.
- Xpel is building its stickiness through an ecosystem of direct distribution, training and DAP cutting software which should give it an edge to maintain high growth.
- Company-owned install shops should provide upside and a method to exploit its direct distribution model internationally.
- Xpel trades at a significant discount due to its obscurity, stock listing and illiquidity and potentially worth multiples of today's price.
- Continued performance, a potential stock uplisting next year and a potential takeover in the mid-term provide catalysts to value creation.
(Note: Shares are also traded on the Canadian TSX Venture exchange in $USD under the ticker DAP.U-V.)
Few companies come around during an investors' lifetime that have a probable chance of changing one's life if enough capital is allocated to it. These companies have a rare combination of extremely high economics, are run by high quality, incentivized owner-operators, have defensible characteristics, high consistent growth with potential to continue high growth, and are trading at a fair price. Charlie Munger even said that if you can find these companies early in their business development, then it would be a mistake to not invest in them. To illustrate that point, Munger and Buffett have admitted to mistakes of omission especially their omission of not investing in Wal-Mart in the early days. For investors like ourselves, when investing in compounders for the long term it is best to learn from others who have already made big mistakes of omission, since by the time we notice our omission mistakes the opportunity costs are likely to be huge. In Buffett and Munger's case Wal-Mart cost them somewhere around $10 billion.
We think Xpel Technologies (OTC:XPLT) is one of those rare businesses that is early in its growth that fits almost all of the qualities that could make this a long-term compounder:
- Return on assets >20% since 2010
- Return on equity >30% since 2010
- Business needs little capital to grow and has maintained ROIC above 20% since 2009
- Insiders own ~50% of shares with the CEO owning ~6%
- Zero dilution from stock options
- Recurring like revenues, marketing advantage and plenty of operating leverage
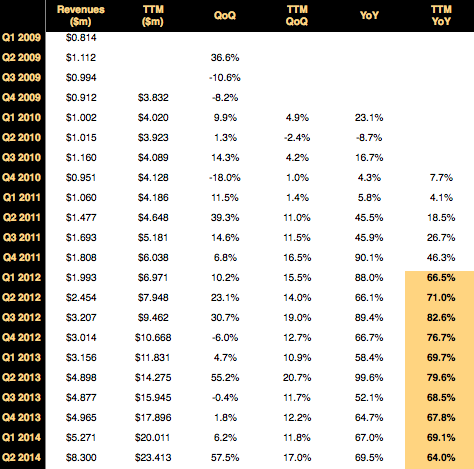
- Consistent trailing-twelve-month growth over 60% the past 10 quarters since CEO Ryan Pape has been at the helm
- Paint Protection Film has only 2% adoption rate in the US and much less internationally meaning plenty of growth potential
 You might expect a company with the above credentials to be trading for ridiculously high multiples, but it actually does not. Since there is already aquality write-up done on Xpel explaining what the company does, the industry which it competes in and growth opportunities we think there is no need to rehash them here in this article.
We will focus on why this company is rare by comparisons with another high compounder of the past, highlighting the company's structural advantages, detailing the value dislocation and why it is occurring as well as outlining the several catalysts that could help push the share price closer to intrinsic value.
You might expect a company with the above credentials to be trading for ridiculously high multiples, but it actually does not. Since there is already aquality write-up done on Xpel explaining what the company does, the industry which it competes in and growth opportunities we think there is no need to rehash them here in this article.
We will focus on why this company is rare by comparisons with another high compounder of the past, highlighting the company's structural advantages, detailing the value dislocation and why it is occurring as well as outlining the several catalysts that could help push the share price closer to intrinsic value.
- Xpel's growth over the past 4 years is on-par with growth of Wal-Mart post IPO and both have many traits in common.
- Xpel is building its stickiness through an ecosystem of direct distribution, training and DAP cutting software which should give it an edge to maintain high growth.
- Company-owned install shops should provide upside and a method to exploit its direct distribution model internationally.
- Xpel trades at a significant discount due to its obscurity, stock listing and illiquidity and potentially worth multiples of today's price.
- Continued performance, a potential stock uplisting next year and a potential takeover in the mid-term provide catalysts to value creation.
Second to None Growth
"One method is what I'd call the method of finding them small get 'em when they're little. For example, buy Wal-Mart when Sam Walton first goes public and so forth. And a lot of people try to do just that. And it's a very beguiling idea. If I were a young man, I might actually go into it." - Charlie Munger
Few companies in the recent past and even far past have had the consistent high growth Xpel has achieved over the last 10 quarters as shown below. Shareholders tend to focus on the trailing-twelve-month year-over-year numbers since quarter-over-quarter and year-over-year numbers tend to be distorted by shifting seasonal orders.
 (Source: 2009-2014 MD&As)
(click to enlarge)
(Source: 2009-2014 MD&As)
(click to enlarge) (Source: Xpel Presentation)
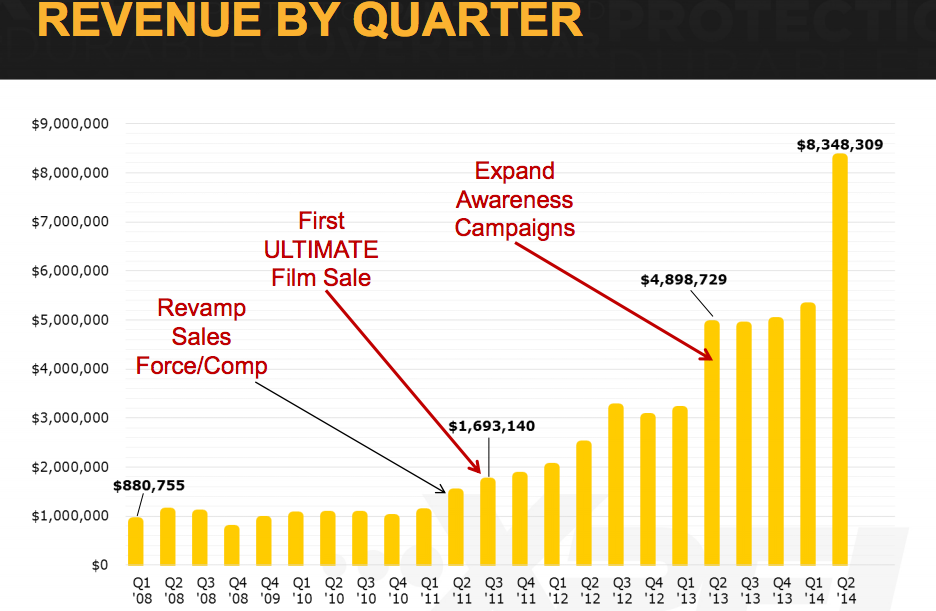
It was Xpel's focus on its marketing and distribution model, as well as the introduction of its Ultimate paint protection film line that first led to the large consistent increase in sales. The further bump in growth the past year has been a result of the company's increased marketing, expanding domestically through company-owned installation facilities and expansion abroad.
Looking through history books we can only find a few companies that have sustained growth on Xpel's scale for a number of years. Following Charlie Munger's suggestion of going after Wal-Mart (NYSE:WMT) when Sam Walton goes public is a good starting point. Let's take a look at Wal-Mart's revenue growth post IPO and compare it with Xpel after its marketing focus on paint protection film - PPF:
(Source: Xpel Presentation)
It was Xpel's focus on its marketing and distribution model, as well as the introduction of its Ultimate paint protection film line that first led to the large consistent increase in sales. The further bump in growth the past year has been a result of the company's increased marketing, expanding domestically through company-owned installation facilities and expansion abroad.
Looking through history books we can only find a few companies that have sustained growth on Xpel's scale for a number of years. Following Charlie Munger's suggestion of going after Wal-Mart (NYSE:WMT) when Sam Walton goes public is a good starting point. Let's take a look at Wal-Mart's revenue growth post IPO and compare it with Xpel after its marketing focus on paint protection film - PPF:
"One method is what I'd call the method of finding them small get 'em when they're little. For example, buy Wal-Mart when Sam Walton first goes public and so forth. And a lot of people try to do just that. And it's a very beguiling idea. If I were a young man, I might actually go into it." - Charlie Munger
Wal-Mart
- 1970-1971 - 43.5%
- 1971-1972 - 76%
- 1972-1973 - 60.1%
- 1973-1974 - 34%
Xpel
- 2010-2011 - 46.28%
- 2011-2012 - 76.6%
- 2012-2013 - 67.8%
- 2013-2014 - est. >60%
The results are eerily similar. We do not have Wal-Mart data pre IPO, however, we guess that Wal-Mart grew at a higher pace before the IPO than after the IPO since by 1970 Wal-Mart had 32 stores making growth rates in the first few stores would have been higher. In comparison, we can clearly see from the chart above that Xpel's growth before 2010 was actually lower as it focused on its previous business model of selling its DAP film cutting software with a much lower emphasis on marketing and distributing its films. The current business model is actually 180 degrees different by focusing on selling Xpel's PPF products and de-emphasizing DAP software sales outside Xpel sellers. Xpel's revenue growth is actually picking up steam since it refocused the business model and looks to be sustainable at much higher rates than Wal-Mart's which fell down to the 20% annually after 1974.
We doubt that Xpel will be able to sustain 25% annual growth for thirty years like Wal-Mart did (essentially reaching $20 billion in annual revenues by 2044), but Xpel does have some traits in common with the young Wal-Mart that gives it a fighting chance to continue to dominate the Paint Protection Film industry as it grows and potential to achieve above average market returns.
Clean Share Structure and Aligned Owner-Operators
At around Wal-Mart's IPO we estimate there to have been a total of approximately 1.6 million shares outstanding (Wal-Mart has undergone 11, 2:1 splits). The 300,000 shares that were issued during the IPO meant that there was a very small trading float and the share structure looks to have been clean of any stock dilution. While the micro-cap universe today could be seen as the wild west of investable assets, Xpel's share structure is one of the few public companies, regardless of size, that has a relatively small share count, low trading float with ~50% owned by insiders and zero dilution from stock options. Insider ownership is not concentrated all in one shareholder but spread out amongst executives and directors. CEO Ryan Pape owns close to 6% of the company and such a share structure conveys that management is trying to align themselves fully with creating value over the long term.
(click to enlarge) (Source: Xpel Presentation)
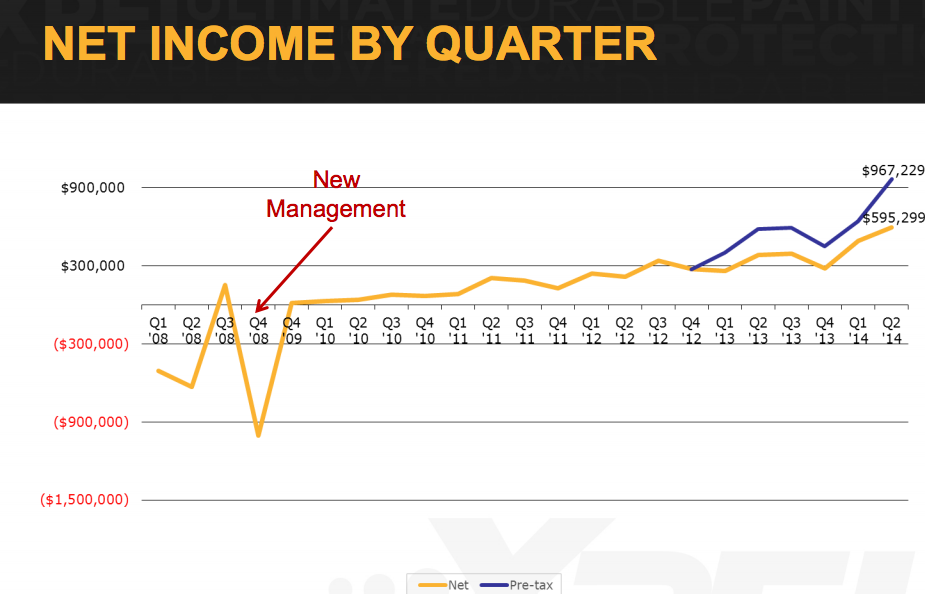
Above shows Xpel since Ryan Pape became CEO. Clearly the results of the management and the change in business model speaks for itself.
(Source: Xpel Presentation)
Above shows Xpel since Ryan Pape became CEO. Clearly the results of the management and the change in business model speaks for itself.
Competitive Advantages
For Xpel to continue growing at high rates it has to be able to fend off competition and sustain/grow its market share as the PPF market continues to grow globally. Paint protection films have reached a point where different paint films are somewhat hard to differentiate which is not too different than retail. Sam Walton showed that he was able to differentiate retail by controlling costs and creating a different distribution model. Xpel's CEO has made it clear that he is trying to build stickiness through an ecosystem of distribution, training and DAP cutting software.
First let us look at the PPF distribution model. Common amongst competitors and 3M has been for them to sell to distributors who then would sell to each installer. Customer concentration is higher under this model and more importantly the distribution model provides little support to installers after the sale. Xpel has cut out the distributor by marketing and selling directly to installers. By cutting out the distributor Xpel can provide better service to installers through installer education/support, marketing of paint protection film and ability to use its DAP cutting software. Creating an ecosystem where installers can flourish is likely to be the system that sustains majority market share. Xpel has been able to master this direct distribution model in the US, however, still relies on the distributor model internationally. This is changing, which we will highlight in the company-owned install shop section.
Many independent installers provide other services than PPF resulting in a range of installer abilities. For PPF to reach an adoption rate on par with window tint (35-40% new cars), independent installers have to be proficient in applying PPF. Keep in mind that window tinting could be considered on a level of difficulty lower than PPF since PPF is applied to larger areas of the automobile that are of different shapes. The installer pool skill set is a bottleneck in the adoption growth of PPF. Xpel goes the extra mile by providing education to installers treating them more like associates (think Wal-Mart here) and providing the skills to complete better installations. The result is an installer who performs better installs, has a better chance of satisfying customers and achieving higher business performance. At the end of the day the direct to installer model is a win-win for everyone in comparison with the distribution model.
Xpel's ecosystem does not stop at education. To apply PPF an installer must have precisely cut film to install on each part of many different car models. Xpel has the DAP cutting software that has a very large database of 70,000 vehicle applications to cut precise film patterns which lowers install time and increases install precision. Xpel previously marketed this software to any installer, but now is phasing out the DAP software to non-Xpel installers. This software then becomes a sticky point for installers since having access to the largest up-to-date database would be extremely valuable. Xpel understands this edge and has a dedicated team that specifically works on designing patterns for new car models and models not in its database.
Xpel's ecosystem so far has proven to be effective in both creating sticky relationships with installers and increasing the adoption rate of PPF which currently stands at approximately 2% domestically and much less internationally. We think the company is mindfully trying to expand the ecosystem to differentiate its service over other competitors allowing it to maintain high market share many years into the future.
Company-Owned Install Shops
Over the past year Xpel has taken ownership of the vertical even further by acquiring and running a few of its own install shops in the US. These owned install shops provide the company with experience of running an install shop operation but also provides operating leverage as Xpel normally receives about $35-$120 gross margin per domestic car install. Owned install shops greatly enhance earnings potential per install and at roughly $1 million in revenue per install shop/year plus high margins, each install shop is a material addition to the company's earnings currently.
One might think that these install shops could compete with the current base of installers, however, Xpel is being opportunistic and highly selective on each location to make sure there is not any competition between its current installer base. Xpel-owned install shops have shown Xpel company installers are likely to be of higher skill set with installing as its only focus is installing paint protection film and especially Xpel's products. Even if there was a non-company-owned install shop near an Xpel-owned shop it is likely that they would not be even competing for the same customers. Dealerships want to work with the highest quality installers and since Xpel install shops would only focus on applying PPF, Xpel shops would likely be better suited to Dealer clients. Independent clients would likely be selling other services and potentially have a lower PPF installation skill set and would be targeting after market installs by enthusiasts and other consumers.
What we believe Xpel's main reason in opening these operations in the US was to test its ability to run its own operations to be replicated abroad. Xpel has been operating under the distribution model internationally so operating install shops in different markets abroad allow it to utilize the direct distribution model that it has perfected in North America. As of October 2nd, Xpelannounced that it has opened a company-owned operation in the UK. This install shop now gives the company a presence in Europe to educate installers, distribute film and market to both consumers and to installers in the area. As the company once had a distributor who sold to numerous installers in the UK, Xpel is likely to convert those installers into direct customers. Why wouldn't they as they would have Xpel's direct support instead of working with a salesman distributor. Xpel is likely to be a force to reckon with if this model proves to successfully transfer in other markets outside North America and the UK.
Valuation
Xpel is a quality company with a highly probable chance of continuing high growth, so it is a huge mistake to value this company utilizing traditional value criteria. One might look at the high trailing P/E and be turned off, however, the current price looks extremely attractive.
When we look at valuation we look at where the company could be trading in 5 to 10 years. Xpel management believes that PPF should be able to reach about 10-12% penetration rate or ~$180 million domestically (@11% of 15.5 million new cars sold and $105 per install for PPF). With 40% market share, which management has alluded to, Xpel could grow revenues to $71 million a year just in the domestic market. This number could be a bit conservative since window tinting has somewhere around a 35-40% penetration rate and car sales could increase over the years.
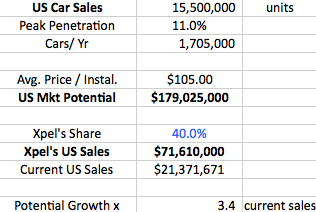 (Source: Our Calculations)
Internationally we estimate roughly 5% peak penetration rate as international market sales have a higher proportion of sales from less wealthy nations. On67 million new cars sold a year that would equal a total market for PPF at 3.3 million cars a year. Average revenue per car internationally is likely to be much higher than the domestic $105/car since pollution and sand is likely to drive full car wrap installations. To stay conservative we continue to use the same $105/car. Again, if Xpel were to maintain a 40% market share international sales would equal approximately $140 million for Xpel.
(Source: Our Calculations)
Internationally we estimate roughly 5% peak penetration rate as international market sales have a higher proportion of sales from less wealthy nations. On67 million new cars sold a year that would equal a total market for PPF at 3.3 million cars a year. Average revenue per car internationally is likely to be much higher than the domestic $105/car since pollution and sand is likely to drive full car wrap installations. To stay conservative we continue to use the same $105/car. Again, if Xpel were to maintain a 40% market share international sales would equal approximately $140 million for Xpel.
 (Source: Our Calculations)
On a conservative basis domestic and international sales would then equal approximately $210 million in revenues to Xpel. At relatively moderate growth rates (23% CAGR domestic and 42% CAGR international) it would take the company approximately 6-7 years to grow to this size in revenues. Keep in mind our assumptions are based off of 2013-2014 car sales, do not take into account the overall growth in car sales over the 6-7 years' time frame and do not include revenues from owned install shops.
Xpel currently produces 12% EBIT and is likely to expand with a higher mix of owned retail stores and other operating leverage. We think a 15% EBIT would be highly conservative and 18%-20% as a possibility by year 6-7. With revenue at $210 million EBIT could be $37.8 million at 18%. Since Xpel has such high returns, 10x EBIT would be achievable so Xpel's valuation would then reach $400 in market cap by year 7. Of course there is substantial upside with higher number of cars sold in emerging markets, Xpel achieving >40% market share internationally, higher revenues per car sold internationally and higher revenues from company-owned install shops.
A quality company growing at such a high rate could fetch a 15x EBIT multiple and still not be too optimistic, so that would be ~$600 million market cap by year 7. If our opportunity cost is 25% annual returns and the FV is $600 million, the PV would be $125 million or $5 a share. The market is currently pricing Xpel at $3 a share, so with our highly conservative estimates the market is under appreciating Xpel's growth potential and quality economics by a long shot even at a very high hurdle rate of 25%.
Keep in mind this is a $77MM company and has relatively low liquidity in the US-listed shares and Canadian Venture-listed shares. These two factors of size and illiquidity alone are enough to deter institutional funds who have both too much money to invest in such a small company and look for companies with significantly higher liquidity to initiate a substantial position and potentially exit. For smaller investors and institutional investors with the structural advantage of small size and no aversion to illiquidity can essentially purchase Xpel before larger institutional investors and other investors.
Usually the market does not keep companies with these growth characteristics and earnings potential this cheap for long, so for the market to anticipate 10% annualized returns until year 7, and $600 million in future value, Xpel would have to be currently trading for $300 million or $12 a share. That is 3 times today's price and if our conservative estimate is achieved over the next 7 years an investor should theoretically be able to still achieve a 10% annualized return, potentially achieving a market beating return.
When value investors talk about margin of safety they tend to want a margin of safety in terms of value below tangible assets. In Xpel's case there are few tangible assets so it trades at a premium to tangible assets. The margin of safety is in the qualitative aspects such as business model, with an emphasis on building a sticky ecosystem, high quality incentivized management and a large growth potential. Quantitatively we estimate there is a ~40% discount to achieving a 25% compounded annual rate for another seven years with potential for additional upside.
Our estimates are not precise and not intended to be. Our estimate of $600 million in revenues by 2021 is likely to be precisely wrong. But with the margin of safety both in the qualitative and quantitative aspects, our estimates could be roughly right or wildly low. It is hard to imagine that Xpel would have fewer than $200 million in revenue in 7 years and trading at a low EBIT multiple. With the share price currently at $3 a share, with little institutional ownership, small share structure and little market following, Xpel looks to have a large margin of safety even after increasing 1,893% in the last two years.
(Source: Our Calculations)
On a conservative basis domestic and international sales would then equal approximately $210 million in revenues to Xpel. At relatively moderate growth rates (23% CAGR domestic and 42% CAGR international) it would take the company approximately 6-7 years to grow to this size in revenues. Keep in mind our assumptions are based off of 2013-2014 car sales, do not take into account the overall growth in car sales over the 6-7 years' time frame and do not include revenues from owned install shops.
Xpel currently produces 12% EBIT and is likely to expand with a higher mix of owned retail stores and other operating leverage. We think a 15% EBIT would be highly conservative and 18%-20% as a possibility by year 6-7. With revenue at $210 million EBIT could be $37.8 million at 18%. Since Xpel has such high returns, 10x EBIT would be achievable so Xpel's valuation would then reach $400 in market cap by year 7. Of course there is substantial upside with higher number of cars sold in emerging markets, Xpel achieving >40% market share internationally, higher revenues per car sold internationally and higher revenues from company-owned install shops.
A quality company growing at such a high rate could fetch a 15x EBIT multiple and still not be too optimistic, so that would be ~$600 million market cap by year 7. If our opportunity cost is 25% annual returns and the FV is $600 million, the PV would be $125 million or $5 a share. The market is currently pricing Xpel at $3 a share, so with our highly conservative estimates the market is under appreciating Xpel's growth potential and quality economics by a long shot even at a very high hurdle rate of 25%.
Keep in mind this is a $77MM company and has relatively low liquidity in the US-listed shares and Canadian Venture-listed shares. These two factors of size and illiquidity alone are enough to deter institutional funds who have both too much money to invest in such a small company and look for companies with significantly higher liquidity to initiate a substantial position and potentially exit. For smaller investors and institutional investors with the structural advantage of small size and no aversion to illiquidity can essentially purchase Xpel before larger institutional investors and other investors.
Usually the market does not keep companies with these growth characteristics and earnings potential this cheap for long, so for the market to anticipate 10% annualized returns until year 7, and $600 million in future value, Xpel would have to be currently trading for $300 million or $12 a share. That is 3 times today's price and if our conservative estimate is achieved over the next 7 years an investor should theoretically be able to still achieve a 10% annualized return, potentially achieving a market beating return.
When value investors talk about margin of safety they tend to want a margin of safety in terms of value below tangible assets. In Xpel's case there are few tangible assets so it trades at a premium to tangible assets. The margin of safety is in the qualitative aspects such as business model, with an emphasis on building a sticky ecosystem, high quality incentivized management and a large growth potential. Quantitatively we estimate there is a ~40% discount to achieving a 25% compounded annual rate for another seven years with potential for additional upside.
Our estimates are not precise and not intended to be. Our estimate of $600 million in revenues by 2021 is likely to be precisely wrong. But with the margin of safety both in the qualitative and quantitative aspects, our estimates could be roughly right or wildly low. It is hard to imagine that Xpel would have fewer than $200 million in revenue in 7 years and trading at a low EBIT multiple. With the share price currently at $3 a share, with little institutional ownership, small share structure and little market following, Xpel looks to have a large margin of safety even after increasing 1,893% in the last two years.
Acquisition Target
The Paint Protection Film industry looks highly attractive and there are a few companies with significant resources with a need for high growth verticals (MMM, Saint Gobain). While the larger paint protection film competitors have a place in the market Xpel is showing that it has the entrepreneurial spirit and skill to run circles around a competitor with billions more dollars in resources. The larger competitors likely do not see the market opportunity yet. We are fairly comfortable in guessing that Ryan Pape and other insiders have a very good grasp of what the company is worth and with their high inside ownership would only sell for the right price, in this case price much higher than today.
It is hard to gauge probabilities of timing and price of a takeover, however, we can estimate a few possibilities. For a larger company to move the needle in terms of revenues and earnings they need to purchase somewhat sizable amounts of revenue and earnings. 3M has ~$30 billion in annual revenue so a $25 million revenue stream growing at a fast rate is still only 0.08% of total revenues. The larger companies might wait until Xpel is of a larger size and its direct distribution model and the industry as a whole is clearly attractive, so it may take a few years for any possible takeover of Xpel.
A company with $100 million in revenues that is growing at high rates could be large enough to make a small material contribution to a large company. If this were to be the case with Xpel, based on our conservative estimate the company would reach $100 million in revenues by approximately year 3. Again utilizing our estimates above of 18% EBIT margin and 15x EBIT multiple the purchase price could be in the neighborhood of $300 million. A 25% hurdle rate would necessitate the company to have a present value of ~$150 million market cap or $6 a share. If institutions and market participants were highly optimistic, essentially baking in the prospects of high growth or a sale, a 10% rate would be a likely rate of return the market would expect necessitating a present value of $225 million or $9 a share.
Risks
A global recession could impact new cars sales and ultimately mute the growth of the paint protection film industry. During the Great Recession in 2009 car sales dropped to 10.4 million units sold. A recession of that magnitude could possibly send new car sales that low or lower domestically and impact international sales. Domestic PPF sales would be impacted, while international sales would likely be minimally affected since international PPF adoption is still in its infancy. Overall, we could still see Xpel growing in a recession, but at a slower pace than current rates.
Competition in the paint protection industry could increase, however, we feel that Xpel's business model will make it much harder for competitors as installers enter its growing ecosystem. On top of that Xpel is leading the way in terms of marketing to installers and consumers.
Currently paint protection film is being in large part installed on exotic cars and cars owned by enthusiasts. The adoption rate of other new car owners is growing but will be important to the company's growth in the future. If Xpel is not able to capture this large market, then growth rates will be lower than we anticipate. We think that the benefits of paint protection film are highly valuable to all car owners in the ability to retain a car's resale value and saving individuals money, preventing paint damage from many sources, while maintaining a car's appearance.
Catalysts
- Q3 could possibly be another high growth quarter, it is likely since higher marketing in the past is starting to pay off as shown in Q2, and new company owned install shops should contribute materially.
- An uplisting to a reputable stock exchange would increase investor awareness especially institutional small cap funds. Management has stated that this is not high on their priority list but could be in the next year.
- A potential takeover by a larger competitor in the paint protection film space or one who wants to enter the industry in the next few years is a possibility.
Conclusion
There are few companies that come around in an investor's lifetime with a rare combination of extremely high economics, are run by high quality, incentivized owner-operators, have defensible characteristics, high consistent growth with potential to continue high growth, and are trading at a fair price. Wal-Mart was one good example and those who invested early and held on compounded their capital at extremely high rates for a long period of time. Xpel Technologies has all the above characteristics and based on our conservative, rough numbers is trading at a highly attractive price. This is not a time to look at past share price performance or traditional value metrics. As the company grows, an uplisting occurs, and trading volume increases the market will have a hard time not noticing Xpel Technologies. A potential takeover at many multiples today's price in the future could also close the valuation gap.
Editor's Note: This article covers one or more stocks trading at less than $1 per share and/or with less than a $100 million market cap. Please be aware of the risks associated with these stocks.
Additional disclosure: This article is meant for instructional purposes and not meant as a recommendation to buy or sell. We are human and can be wrong, especially with our forecasts, so it is extremely important to do your own homework. The only kind of intelligent investing is through your own due diligence. We own both XPLT and DAP.U-V.
Editor's Note: This article covers one or more stocks trading at less than $1 per share and/or with less than a $100 million market cap. Please be aware of the risks associated with these stocks.
The Silicon Valley Behemoth Trying to Corner the Market for Wearable Tech
By Michael A. Robinson, Defense + Tech Specialist, Money Morning

It’s every investor’s dream to find the “next Apple” or “next Google.”
But in their zeal to find the next garage startup, investors too often overlook the already established giants.
And that can be a costly oversight, because the profit potential of a well-run heavyweight can be huge – particularly in the coming wearable tech revolution.
We’re predicting just that kind of upbeat outcome for our third bonus opportunity: Intel Corp. (Nasdaq: INTC).
That’s right: The world’s largest chipmaker is focusing on wearable tech.
And we love its game plan.
The company’s “Make It Wearable” initiative is providing cash grants to developers, entrepreneurs and designers who are targeting the wearable market’s billions in potential revenue. Shrewdly understanding that one impediment to wearable devices is their clunky, un-chic designs, Intel is partnering with fashion industry leaders like Barneys, the
Council of Fashion Designers of America (CFDA), and global fashion retailer Opening Ceremony to develop products that are appealing… as well as functional.
And with its technology behind products like the “smart onesie” Mimo for babies, micro-wireless devices aimed at the health care market and consumer products like “smart headphones,” Intel is demonstrating a willingness to deploy its wearable know-how across different markets.
With revenue north of $50 billion and profits of $10 billion a year, this is a company with the financial heft to own a huge chunk of the wearable tech market.
Remaking Intel From the Inside Out
Founded by tech legends Bob Noyce and Gordon Moore in 1968, Intel is the company that put the “silicon” inSilicon Valley. And for the past 20 years, Intel has been synonymous with microprocessors all over the world. During the PC boom, it teamed with up with software heavyweightMicrosoft Corp. (Nasdaq: MSFT) to create the “Wintel”duopoly.
And its genius wasn’t limited to tech. With its still-remembered“Intel Inside” campaign and the creation of the “Pentium”name, the company branded an otherwise mundane bit of hardware: the microchip.
Rarely is there a computer that we plunk ourselves down in front of that doesn’t have an Intel sticker on it.
Intel isn’t just “inside.” It’s everywhere.
Or almost everywhere.
The Santa Clara, Calif.-based firm dialed the wrong numbers with the mobile wave – and got muscled aside – because chips made by rival ARM Holdings PLC (NasdaqADR: ARMH) were smaller, cheaper, and used less power than Intel’s offerings.
But Intel is using its heft to fight back: It is spending more than $10 billion a year in R&D in a bid to gain a beachhead in wearable and mobile devices – while remaining competitive in PCs.
Intel Puts New Wearables on Display
In some ways, wearables and the closely related “Internet ofEverything” (IoE) are “last stand” markets for Intel.
But we’re OK with that because it’s clear to us that Intel isn’t going to fail.
At the 2014 Consumer Electronics Show, Intel Chief Executive Officer Brian Krzanich devoted most of his keynote to wearable tech – even showing off prototype devices.
Intel’s entry to wearables revolves around Edison, a Pentium-class computer the size and shape of a Secure Digital (SD) card. Despite its small size, Edison has Bluetooth and Wi-Fi connectivity.
The beauty of Edison is its smallness, which gives product developers the option to use it almost anywhere.
The highlighted prototypes included a smartwatch, smart earbuds, a smart earphone headset called Jarvis, and a charging “bowl” that offers consumers a “drop-in dead/pick-up charged” convenience for all of your gadgets.
Krzanich also showed off Mimo, the “smart onesie” that can track Junior’s vital signs and signal the kitchen when it’s time to warm the bottle for the midnight feeding.
Intel says its wearable technology prototypes are “reference designs” to help third-party device makers develop new products.
But just as likely that Intel’s developers want plenty of hands-on experience with wearable devices to ensure that the chips they design for this market are viewed as the new standard. And that will help the company recover some of its “Wintel”-era market power.
This new emphasis on wearables is crucial because it marks a departure for Intel. Rather than compete as a “me too” mobile-chip supplier or smartphone maker, Intel is driving change in the industrywide bid to make all your appliances, gadgets and even your clothes talk to each other – the Holy Grail of the IoE.
Doubling Down on Wearables
And with its late-May buyout of Basis Science Inc. – the maker of smart wristbands for health and fitness –Intel added new muscle to its wearable push.
It helps that Basis focuses on the market that’s probably the most promising for wearable tech firms like Intel.
I’m talking about health care.
Basis’s smart wristbands monitor health data such as heart-rate patterns, sleep stages, motion and burned calories. The company’s focus is health-based devices, which will be the most compelling segment in wearable tech.
“We sought to build the next generation of health trackers that would know more and do more for your health than existing products could,” Basis said in a blog post announcing the deal with Intel.
It also explains why the other suitors for Basis included Apple,
Google, Samsung and possibly even Microsoft.
With its buyout of Basis – as well as its focus on development, setting standards and getting into the mobile game – Intel has clearly found a formula that will push it into the lead in this critical new market.
Cash for Wearable Designs
Reinforcing the notion that many of the greatest ideas are now brought to market by outside designers via its wearable platforms and prototypes, Intel announced the “Make It Wearable” challenge to encourage innovation with its technology.
The global effort calls on the smartest minds to consider factors affecting the proliferation of wearable tech, such as practical uses, aesthetics, battery life, security and privacy.
The challenge will award more than $1.3 million in cash to winners.
Make It Wearable proves Intel is anything but a slow-growth legacy tech company. New sources of revenue from wearables and its aggressive approach toward the Internet of Everything will turn Intel back into a profitable opportunity for investors who understand this new market.
Best of all, we’re talking about a big potential upside – and not much downside.
Intel has roughly $20 billion in cash, giving it plenty of firepower to drive innovation – as well as financing dividends and buybacks.
According to my analysis, investors are valuing Intel’s wearable initiative at pretty close to zero.
In fact, the IoE segment has already shown strong profitability. Revenue jumped 32% on a year-over-year basis to almost $500 million with an 80% surge in operating income.
Intel’s shares trade for just 14 times earnings, and the company’s 3.4% dividend makes it one of the highest yielding large-cap stocks you’ll find. Intel also spent $2.44 billion to repurchase shares in 2013.
Here we have a $130 billion Goliath ready to devote a mammoth portion of its resources to the newest frontier of computing. You don’t often get a chance to invest in an entirely new industry. But Intel offers you a chance to do so with a low-risk/high-profit formula you’re not likely to find anywhere else.
And for the past 20 years, Intel has been synonymous with microprocessors all over the world. During the PC boom, it teamed with up with software heavyweightMicrosoft Corp. (Nasdaq: MSFT) to create the “Wintel”duopoly.
And its genius wasn’t limited to tech. With its still-remembered“Intel Inside” campaign and the creation of the “Pentium”name, the company branded an otherwise mundane bit of hardware: the microchip.
Rarely is there a computer that we plunk ourselves down in front of that doesn’t have an Intel sticker on it.
Intel isn’t just “inside.” It’s everywhere.
Or almost everywhere.
The Santa Clara, Calif.-based firm dialed the wrong numbers with the mobile wave – and got muscled aside – because chips made by rival ARM Holdings PLC (NasdaqADR: ARMH) were smaller, cheaper, and used less power than Intel’s offerings.
But Intel is using its heft to fight back: It is spending more than $10 billion a year in R&D in a bid to gain a beachhead in wearable and mobile devices – while remaining competitive in PCs.
Intel Puts New Wearables on Display
In some ways, wearables and the closely related “Internet ofEverything” (IoE) are “last stand” markets for Intel.
But we’re OK with that because it’s clear to us that Intel isn’t going to fail.
At the 2014 Consumer Electronics Show, Intel Chief Executive Officer Brian Krzanich devoted most of his keynote to wearable tech – even showing off prototype devices.
Intel’s entry to wearables revolves around Edison, a Pentium-class computer the size and shape of a Secure Digital (SD) card. Despite its small size, Edison has Bluetooth and Wi-Fi connectivity.
The beauty of Edison is its smallness, which gives product developers the option to use it almost anywhere.
The highlighted prototypes included a smartwatch, smart earbuds, a smart earphone headset called Jarvis, and a charging “bowl” that offers consumers a “drop-in dead/pick-up charged” convenience for all of your gadgets.
Krzanich also showed off Mimo, the “smart onesie” that can track Junior’s vital signs and signal the kitchen when it’s time to warm the bottle for the midnight feeding.
Intel says its wearable technology prototypes are “reference designs” to help third-party device makers develop new products.
But just as likely that Intel’s developers want plenty of hands-on experience with wearable devices to ensure that the chips they design for this market are viewed as the new standard. And that will help the company recover some of its “Wintel”-era market power.
This new emphasis on wearables is crucial because it marks a departure for Intel. Rather than compete as a “me too” mobile-chip supplier or smartphone maker, Intel is driving change in the industrywide bid to make all your appliances, gadgets and even your clothes talk to each other – the Holy Grail of the IoE.
Doubling Down on Wearables
And with its late-May buyout of Basis Science Inc. – the maker of smart wristbands for health and fitness –Intel added new muscle to its wearable push.
It helps that Basis focuses on the market that’s probably the most promising for wearable tech firms like Intel.
I’m talking about health care.
Basis’s smart wristbands monitor health data such as heart-rate patterns, sleep stages, motion and burned calories. The company’s focus is health-based devices, which will be the most compelling segment in wearable tech.
“We sought to build the next generation of health trackers that would know more and do more for your health than existing products could,” Basis said in a blog post announcing the deal with Intel.
It also explains why the other suitors for Basis included Apple,
Google, Samsung and possibly even Microsoft.
With its buyout of Basis – as well as its focus on development, setting standards and getting into the mobile game – Intel has clearly found a formula that will push it into the lead in this critical new market.
Cash for Wearable Designs
Reinforcing the notion that many of the greatest ideas are now brought to market by outside designers via its wearable platforms and prototypes, Intel announced the “Make It Wearable” challenge to encourage innovation with its technology.
The global effort calls on the smartest minds to consider factors affecting the proliferation of wearable tech, such as practical uses, aesthetics, battery life, security and privacy.
The challenge will award more than $1.3 million in cash to winners.
Make It Wearable proves Intel is anything but a slow-growth legacy tech company. New sources of revenue from wearables and its aggressive approach toward the Internet of Everything will turn Intel back into a profitable opportunity for investors who understand this new market.
Best of all, we’re talking about a big potential upside – and not much downside.
Intel has roughly $20 billion in cash, giving it plenty of firepower to drive innovation – as well as financing dividends and buybacks.
According to my analysis, investors are valuing Intel’s wearable initiative at pretty close to zero.
In fact, the IoE segment has already shown strong profitability. Revenue jumped 32% on a year-over-year basis to almost $500 million with an 80% surge in operating income.
Intel’s shares trade for just 14 times earnings, and the company’s 3.4% dividend makes it one of the highest yielding large-cap stocks you’ll find. Intel also spent $2.44 billion to repurchase shares in 2013.
Here we have a $130 billion Goliath ready to devote a mammoth portion of its resources to the newest frontier of computing. You don’t often get a chance to invest in an entirely new industry. But Intel offers you a chance to do so with a low-risk/high-profit formula you’re not likely to find anywhere else.
By Michael A. Robinson, Defense + Tech Specialist, Money Morning
It’s every investor’s dream to find the “next Apple” or “next Google.”
But in their zeal to find the next garage startup, investors too often overlook the already established giants.
And that can be a costly oversight, because the profit potential of a well-run heavyweight can be huge – particularly in the coming wearable tech revolution.
We’re predicting just that kind of upbeat outcome for our third bonus opportunity: Intel Corp. (Nasdaq: INTC).
That’s right: The world’s largest chipmaker is focusing on wearable tech.
And we love its game plan.
The company’s “Make It Wearable” initiative is providing cash grants to developers, entrepreneurs and designers who are targeting the wearable market’s billions in potential revenue. Shrewdly understanding that one impediment to wearable devices is their clunky, un-chic designs, Intel is partnering with fashion industry leaders like Barneys, the
Council of Fashion Designers of America (CFDA), and global fashion retailer Opening Ceremony to develop products that are appealing… as well as functional.
And with its technology behind products like the “smart onesie” Mimo for babies, micro-wireless devices aimed at the health care market and consumer products like “smart headphones,” Intel is demonstrating a willingness to deploy its wearable know-how across different markets.
With revenue north of $50 billion and profits of $10 billion a year, this is a company with the financial heft to own a huge chunk of the wearable tech market.
Remaking Intel From the Inside Out
Founded by tech legends Bob Noyce and Gordon Moore in 1968, Intel is the company that put the “silicon” inSilicon Valley. And for the past 20 years, Intel has been synonymous with microprocessors all over the world. During the PC boom, it teamed with up with software heavyweightMicrosoft Corp. (Nasdaq: MSFT) to create the “Wintel”duopoly.
And for the past 20 years, Intel has been synonymous with microprocessors all over the world. During the PC boom, it teamed with up with software heavyweightMicrosoft Corp. (Nasdaq: MSFT) to create the “Wintel”duopoly.
And its genius wasn’t limited to tech. With its still-remembered“Intel Inside” campaign and the creation of the “Pentium”name, the company branded an otherwise mundane bit of hardware: the microchip.
Rarely is there a computer that we plunk ourselves down in front of that doesn’t have an Intel sticker on it.
Intel isn’t just “inside.” It’s everywhere.
Or almost everywhere.
The Santa Clara, Calif.-based firm dialed the wrong numbers with the mobile wave – and got muscled aside – because chips made by rival ARM Holdings PLC (NasdaqADR: ARMH) were smaller, cheaper, and used less power than Intel’s offerings.
But Intel is using its heft to fight back: It is spending more than $10 billion a year in R&D in a bid to gain a beachhead in wearable and mobile devices – while remaining competitive in PCs.
Intel Puts New Wearables on Display
In some ways, wearables and the closely related “Internet ofEverything” (IoE) are “last stand” markets for Intel.
But we’re OK with that because it’s clear to us that Intel isn’t going to fail.
At the 2014 Consumer Electronics Show, Intel Chief Executive Officer Brian Krzanich devoted most of his keynote to wearable tech – even showing off prototype devices.
Intel’s entry to wearables revolves around Edison, a Pentium-class computer the size and shape of a Secure Digital (SD) card. Despite its small size, Edison has Bluetooth and Wi-Fi connectivity.
The beauty of Edison is its smallness, which gives product developers the option to use it almost anywhere.
The highlighted prototypes included a smartwatch, smart earbuds, a smart earphone headset called Jarvis, and a charging “bowl” that offers consumers a “drop-in dead/pick-up charged” convenience for all of your gadgets.
Krzanich also showed off Mimo, the “smart onesie” that can track Junior’s vital signs and signal the kitchen when it’s time to warm the bottle for the midnight feeding.
Intel says its wearable technology prototypes are “reference designs” to help third-party device makers develop new products.
But just as likely that Intel’s developers want plenty of hands-on experience with wearable devices to ensure that the chips they design for this market are viewed as the new standard. And that will help the company recover some of its “Wintel”-era market power.
This new emphasis on wearables is crucial because it marks a departure for Intel. Rather than compete as a “me too” mobile-chip supplier or smartphone maker, Intel is driving change in the industrywide bid to make all your appliances, gadgets and even your clothes talk to each other – the Holy Grail of the IoE.
Doubling Down on Wearables
And with its late-May buyout of Basis Science Inc. – the maker of smart wristbands for health and fitness –Intel added new muscle to its wearable push.
It helps that Basis focuses on the market that’s probably the most promising for wearable tech firms like Intel.
I’m talking about health care.
Basis’s smart wristbands monitor health data such as heart-rate patterns, sleep stages, motion and burned calories. The company’s focus is health-based devices, which will be the most compelling segment in wearable tech.
“We sought to build the next generation of health trackers that would know more and do more for your health than existing products could,” Basis said in a blog post announcing the deal with Intel.
It also explains why the other suitors for Basis included Apple,
Google, Samsung and possibly even Microsoft.
With its buyout of Basis – as well as its focus on development, setting standards and getting into the mobile game – Intel has clearly found a formula that will push it into the lead in this critical new market.
Cash for Wearable Designs
Reinforcing the notion that many of the greatest ideas are now brought to market by outside designers via its wearable platforms and prototypes, Intel announced the “Make It Wearable” challenge to encourage innovation with its technology.
The global effort calls on the smartest minds to consider factors affecting the proliferation of wearable tech, such as practical uses, aesthetics, battery life, security and privacy.
The challenge will award more than $1.3 million in cash to winners.
Make It Wearable proves Intel is anything but a slow-growth legacy tech company. New sources of revenue from wearables and its aggressive approach toward the Internet of Everything will turn Intel back into a profitable opportunity for investors who understand this new market.
Best of all, we’re talking about a big potential upside – and not much downside.
Intel has roughly $20 billion in cash, giving it plenty of firepower to drive innovation – as well as financing dividends and buybacks.
According to my analysis, investors are valuing Intel’s wearable initiative at pretty close to zero.
In fact, the IoE segment has already shown strong profitability. Revenue jumped 32% on a year-over-year basis to almost $500 million with an 80% surge in operating income.
Intel’s shares trade for just 14 times earnings, and the company’s 3.4% dividend makes it one of the highest yielding large-cap stocks you’ll find. Intel also spent $2.44 billion to repurchase shares in 2013.
Here we have a $130 billion Goliath ready to devote a mammoth portion of its resources to the newest frontier of computing. You don’t often get a chance to invest in an entirely new industry. But Intel offers you a chance to do so with a low-risk/high-profit formula you’re not likely to find anywhere else.
from a group of money managers, market experts and financial journalists competing against each other for the best return throughout all of 2014. The year-to-date returns below will be based on market close Tuesday, Dec. 31.
Throughout the year, the contributors will regularly offer updates on the good, the bad and the unexpected as it relates to their Best Stocks for 2014 pick.
Questions about the Best Stocks for 2014 picks or contributors on the list? Email us ateditor@investorplace.com or engage in the conversation on Twitter using hashtag #beststocks.
MAJOR INDICES - YTD PERFORMANCES
1
")
41%
Current Return
Buy Price: $150.43
Current Price: $212.37
Industry: Automaking

2
")
30%
Current Return
Buy Price: $44.33
Current Price: $57.72
Industry: Diversified Energy
Latest News: Best Stocks Update: EMES Continues to Shine

3
")
4%
Current Return
Buy Price: $9.07
Current Price: $9.39
Industry: European Banking

4
")
1%
Current Return
Buy Price: $20.37
Current Price: $20.66
Industry:Telecommunications

5
")
1%
Current Return
Buy Price: $26.30
Current Price: $26.66
Industry: Emerging Markets
Latest News: EUM – Bet Against Emerging Markets in 2014

6
Financial SPDR (XLF)
")
1%
Current Return
Buy Price: $21.86
Current Price: $22.11
Industry: Financial
Latest News: Best Stocks Update: XLF Has Room to Grow

7
Vanguard Dividend Appreciation ETF (VIG)
")
-0%
Current Return
Buy Price: $74.91
Current Price: $74.65
Industry: Dividend Fund
Latest News: Best Stocks Update: VIG’s Time Is Coming

8
FleetCor Technologies (FLT)
")
-3%
Current Return
Buy Price: $117.17
Current Price: $113.36
Industry: Business Services

9
Citigroup (C)
")
-9%
Current Return
Buy Price: $52.11
Current Price: $47.25
Industry: Banking
Latest News: C – Citigroup Stock Offers a One-Two Punch

10
Fortegra Financial (FRF)
")
-15%
Current Return
Buy Price: $8.27
Current Price: $7.05
Industry: Insurance
Latest News: Fortegra Stock Is a Winner For Patient Investors

Investor:
Tremor Video Is A Strong Buy At A Big Discount To IPO Price
 Summary
- Company in midst of epic transformation to programmatic advertising solution, which will drive future margin expansion and revenues.
- After a recent IPO at $10, Tremor has an impeccable balance sheet with nearly $2 per share cash, no debt and positive net operating cash flow in 2013.
- High growth story in booming niche industry with analyst projections of a 25% increase in sales from 2014-2015 driven by exclusive publisher deals.
- Multiple accounts of insider buying and zero instances of selling since August 2013 IPO which is very unusual for an IPO.
- Likely takeover target due to proprietary software and patents and same CEO and CFO combination that found and sold About.com to Primedia.

Over the course of my investing career, by far my most successful trades have been busted IPOs. Readers of mine will remember my very bullish articles that ran contrary to extreme negative sentiment at the time in bothSkullcandy (SKUL) and Audience (ADNC). These two relatively recent IPOs both fell to historic lows only to rebound sharply shortly thereafter. In both these cases, when I wrote about these companies, analysts were screaming sell and investors had given up all hope. I caught the bottom in both of these stocks and investors that had an open mind and listened to my contrarian view were richly rewarded. Both of these companies more than doubled off their lows in a short period of time. Today I present another similar story, a stock that nobody wants to touch with a 10-foot pole, Tremor Video (TRMR). I am perhaps more bullish than ever before on this company due to an epic transformation under way in the online advertising world, one where Tremor Video is leading the shift with a powerful drive.
Tremor Video went public in a late June 2013 IPO where it raised over $118 million at $10 per share. After briefly trading at above $11 prior to Q3 earnings, Tremor dropped over 50% on November 8 after lowering revenue and earnings guidance. Just like YuMe (YUME), my favorite ad tech play that I recently featured in an article, Tremor was simply caught with its pants down in its first year as a public company trying to predict the unpredictable and inconsistent nature of customer advertising spend. It was severely punished and has not recovered since. As a result, investors have a unique opportunity here to achieve extraordinary returns by taking advantage of this extreme negative sentiment and buying Tremor Video stock near historic lows.
As explained on the Q4 call, while Tremor Video is showing sharply higher demand for their performance-based pricing and programmatic model, margins are still under pressure from legacy demo pricing but there is evidence that this is indeed subsiding. Demo pricing is the traditional buying method in which TV media buyers only pay for ads that were delivered to a particular demographic. Like YuMe, Tremor Video's customers consist of the mega TV brand advertisers that are rapidly moving their footprint online and multi-screen and format. Tremor Video has been pushing advertisers to higher margin performance-based pricing models through the introduction of new mutually beneficial advertising formats and it is working. More specifically, 29.8% of Tremor Video's total revenue in 2013 was attributed to performance-based pricing, compared to only 22.7% in 2012. This is a fundamental shift that is still underway and not fully complete but it is clearly taking place. Adoption will naturally drive margin expansion and this will accelerate even further by the end of Q2 2014 when Tremor Video's VideoHub Connect platform will launch as a full-service programmatic offering. Meanwhile, despite the overly negative sentiment surrounding this company, analysts are estimating that revenues will grow by 25% in 2015. Hardly the bleak situation that you would expect from a company that has lost more than 50% of its market valuation since its recent IPO.
One of the main reasons why I love busted IPOs is because of the impeccable balance sheets, and Tremor Video is no exception. With over $92 million in cash on its most recent balance sheet, Tremor Video has an enormous margin of error available should anything go astray during the transformation. The company has no debt and total shareholder equity that at over $157 million sits just below the market valuation of just over $200 million, which makes this high flying ad tech company a true value proposition with little downside risk from these levels. Furthermore, Tremor Video had a positive net operating cash flow in 2013. There is no reason to believe that EBITDA will not turn positive as early as 2016, although 2015 remains an upside surprise possibility with at least one analyst estimating a breakeven year. All things considered, the company appears to be on the right track to achieving long-term profitability very soon, that is if they do not get acquired first.
CEO Bill Day was one of the founders of About.com, which was bought by Primedia during his leadership tenure at the company. His CFO at the time was Todd Sloan, whom he brought over to Tremor Video a couple years ago. This team did it before and they can do it again as Tremor Video sits in a very unique position among ad tech companies. The company holds key patents, including one recently granted for optimizing video advertising. The patent relates to Tremor Video's sophisticated and proprietary algorithm that works by optimizing an advertisers' video campaign in real time. It considers guaranteed brand-centric metrics such as cost-per-engagement and cost-per-100% viewable and 100% complete. These are all unique performance-based pricing metrics designed by Tremor Video that deliver not only high returns to the advertiser but drive high margin expansion for the company itself. This is the future of video advertising and it is only in its infancy at the moment. Tremor Video is an innovator in this space.
Furthermore, Tremor Video has exclusive advertising deals in place with significant publishers such as Meredith Digital. This deal was likely inked byPresident of Global Sales Lauren Wiener, who was a long-time Meredith executive. It also has unique 3 or 4 year deals with major publishers like Viacom, AMC, A+E Networks and over 200 other exclusive partners within its advertising ecosystem. These contracts offer tremendous value to a potential acquirer as they are both quantifiable and exclusive. On the Q4call, CEO Bill Day mentioned that the publishers with whom they have exclusive deals with are satisfied with the partnerships and that existing contracts coming up for renewal will likely be renewed.
Finally, since the massive stock price drop insiders have been buying repeatedly. CEO Bill Day has purchased stock on the open market on four different occasions in the past several months totaling 33,000 shares. As well, CFO Todd Sloan and President Lauren Weiner have both made two open market purchases each. Three other directors have also made recent insider purchases. Most importantly, there has been zero selling of any shares by any entity since the IPO. This is quite unusual as at the very least the private equity and venture capital groups normally take advantage of the opportunity to cash at least some of their shares out, but so far none have sold even a single share. The people who know the most about the company's fortune and proprietary technology are not selling and are anticipating a higher price than even the $10 or higher they could have sold for in and around the IPO last June. I can't remember the last IPO where none of the insiders sold nearly a year after the event. That to me demonstrates extreme confidence in the company's future prospects.
In summary, investors have a very special opportunity to buy shares of a rapidly growing company in the midst of an epic transformation to a fully programmatic advertising solution at an over 50% discount to the IPO price. Downside risk is relatively low due to the nearly $2 per share in cash on hand, zero debt and the high shareholder equity that is close to the current market valuation. The negative sentiment surrounding Tremor Video is more due to investors not properly understanding the fundamental shift in video as evidenced by the rampant insider buying and the complete lack of selling since the IPO. I have increased my long position significantly over the past few days and it currently stands as my second largest holding behind YuMe. I plan to continue to accumulate shares throughout this quarter. It is not the easiest stock to buy as even small orders are difficult to fill, which indicates to me that there is a serious background demand for the shares despite the discounted price.
Synaptics on growth path again, thanks to smartphones
By PATRICK SEITZ, INVESTOR'S BUSINESS DAILY
Posted 08/02/2013 03:04 PM ET
Posted 08/02/2013 03:04 PM ET

Synaptics (SYNA), a maker of user interface technology for consumer electronics, has returned to growth thanks to its penetration of the smartphone market.
The San Jose, Calif.-based company has now posted two quarters in a row of solid sales and earnings growth after seven straight quarters of decline. Synaptics has transitioned its business from a PC focus to a mobile-device focus. Synaptics makes touch pads for notebook computers and touch screens for smartphones, tablets and PCs.
Synaptics late Thursday posted fiscal fourth-quarter results that beat Wall Street estimates. It earned $1.39 a share excluding items, vs. analyst expectations of $1.28, for the quarter ended June 30. Synaptics generated sales of $230 million, topping analyst views of $229 million. On a year-over-year basis, earnings per share were up 157% and sales were up 67%. That's an acceleration from the March quarter when EPS rose 55% and sales increased 24%.
"A year ago, we said fiscal 2013 was all about growing, both year over year and through the course of each quarter. And that's exactly what we did," Synaptics CEO Rick Bergman told IBD. "We're really focused on how we can sustain this growth rate."
Sales rose 21% to $664 million in fiscal 2013 and Synaptics is looking for similar growth this year, Bergman said.
In the June quarter, 75% of Synaptics revenue came from mobile devices and 25% from PCs. Revenue from mobile products rose 186% year over year to $173 million. Revenue from PC products fell 26% to $57 million.
"Certainly the smartphone market was booming in calendar Q2 and we're in virtually every high-end smartphone, with the exception ofApple (AAPL), at this juncture," Bergman said. "Overall, people are still out there wanting the best smartphones they can get. So that was part of the growth story."
Synaptics technology is in smartphones from top manufacturer Samsung, as well as vendors like Nokia (NOK) and Sony (SNE).
Bergman is cautious about the PC market.
"We're planning for flat to slightly down (PC sales) when we do our internal planning," he said. But the introduction of Microsoft's (MSFT) Windows 8.1 and new ultrabooks and touch-screen notebooks at lower prices could prompt consumer upgrades, he says.
"It seems like we should get an uptick, especially coupled with an interesting replacement cycle that should be occurring in the commercial marketplace," he said.
Synaptics stock was down a fraction, near 40.50, in afternoon trading in the stock marketFriday, but shares are up 35% in 2013.
Nektar Therapeutics Presents Positive Data from Human Abuse Liability Study for NKTR-181, a First-in-Class Investigational Opioid to Treat Chronic Pain, at 2013 Annual Meeting of The College on Proble
June 19, 2013 8:30 AM ET
- Share0
- 3
NKTR-181 rates similar to placebo on "drug liking" and "feeling high" scores at all doses studied and differentiates from the widely abused drug oxycodone with high statistical significance (p<0.0001)

SAN DIEGO, June 19, 2013 /PRNewswire/ -- Nektar TherapeuticsNKTR today announced positive top-line results from a human abuse liability (HAL -1.16%, news) study for NKTR-181, a first-in-class, opioid analgesic molecule with a slow rate of entry into the brain. This slow rate of entry is designed to reduce the euphoria that can lead to the abuse of and addiction to current opioid analgesics.1 In the study data being presented today, NKTR-181 was rated similar to placebo in "drug liking" and "feeling high" scores and had highly statistically significant lower "drug liking" scores and reduced "feeling high" scores as compared to oxycodone at all doses tested (p<0.0001).
Prescription opioids are critical in the management of moderate-to-severe chronic pain. However, the abuse and misuse of these opioids have led to a serious public health crisis. HAL studies are clinical studies that assess the relative abuse potential of a medicine. These studies are conducted in a non-dependent, recreational drug abuser population and are designed to predict how probable it is that a particular medicine will be attractive to abusers (i.e., "liked"). The primary endpoint for the NKTR-181 HAL study was drug-liking measured on a bi-polar visual analogue scale (VAS). This endpoint is known to correlate most directly with a drug's potential for abuse.2
"It is clear that there is a pressing societal need for better and safer analgesics," said Dr. Lynn Webster, President of the American Academy of Pain Medicine and lead investigator for the study at CRI Lifetree. "We know that speed of entry into the brain is important in abuse. When we look at the critical period following dosing when the commonly abused drug oxycodone reaches maximum liking, NKTR-181 was not distinguished from placebo with respect to both drug-liking and feeling high. These are two of the most important metrics that help us understand the abuse potential of a medicine. Importantly, NKTR-181 was dosed as an oral liquid, which underscores that its less rewarding properties are inherent to this NCE and independent of any abuse-deterrent formulation. These data, along with previous efficacy data, suggest NKTR-181 may be a major advance towards safer opioid therapy for the treatment of moderate to severe chronic pain."
The HAL study compared drug liking between each treatment group (oxycodone 40 mg, Placebo, and NKTR-181 100 mg, 200 mg, and 400 mg). On the bipolar VAS scale (0-100), a score of 50 indicates that the subject "neither likes nor dislikes" the drug. In the study, 40 mg of oxycodone oral solution resulted in a maximum mean drug liking score of 85, indicating a "strong liking" for the effects of oxycodone. The oxycodone liking score was significantly different from placebo as early as 15 minutes after dosing and peaked at 60 minutes. In the placebo arm, the maximum mean drug liking score was 50, indicating that the subjects neither liked nor disliked the effects. NKTR-181 dosing was similar to placebo with maximum mean drug liking VAS scores of 58, 58 and 63 for 100 mg, 200 mg and 400 mg, respectively.
"The data from this study are remarkable and clearly demonstrate that drug abusers could not discriminate NKTR-181 from placebo at doses that we know produced analgesia in the validated pain models from our Phase 1 studies," said Robert Medve MD, SVP and Chief Medical Officer of Nektar Therapeutics. "These data suggest that NKTR-181 could change the way we think about opioids and how we treat patients with chronic pain."
Additional Study Results
- Assessment of "Feeling High"
All oral doses of NKTR-181 scored similar to placebo in a Drug Effects Questionnaire (DEQ) assessing the treatment's effect on how "high" the subject felt (on a scale of 0 (not at all) to 100 (extremely)). Oxycodone oral solution resulted in a maximum mean DEQ score of 81. NKTR-181 maximum mean DEQ scores were 14, 14 and 23 for 100 mg, 200 mg tablet and 400 mg, respectively, with p-values < 0.0001 as compared to oxycodone. Placebo achieved a maximum mean DEQ score of 9.
- Assessment of "Sleepiness"
Sedation was measured using a DEQ assessment of sleepiness (on a scale of 0 (not at all) to 100 (extremely). All doses of NKTR-181 scored lower on sleepiness when compared to oxycodone. The maximum mean DEQ sleepiness score for oxycodone was 44 as compared to the maximum mean DEQ scores for NKTR-181 100 mg, 200 mg and 400 mg of 10, 9, and 18, respectively (p<0.0001).
Study Design
The randomized, double-blind, placebo- and active-controlled, 5-way crossover trial, compared the effects of three doses of NKTR-181 oral solution (100 mg, 200 mg, and 400 mg), to the effects of 40 mg of oxycodone oral solution and placebo. Participants were healthy adults (N=42) who were not currently physically opioid-dependent but had used opioids to attain non-medical effects on at least 10 occasions during the past year and at least once in the 12 weeks before the study. Study participants sequentially received the five treatments, administered in a randomized, double-blinded fashion, with each treatment separated by a washout period. The study also utilized a Williams Square cross-over design, which uses a series of randomized sequences for each individual subject.
About NKTR-181
NKTR-181 is currently being evaluated in Phase 2 development as a twice-daily oral tablet to treat chronic pain. The NKTR-181 Phase 2 study is a double-blind, placebo-controlled, randomized withdrawal study design evaluating the investigational drug candidate in patients with moderate to severe chronic pain from osteoarthritis of the knee. Approximately 200 patients will be randomized to receive either NKTR-181 or placebo in the study.
NKTR-181 is an NCE (new chemical entity) which was created using Nektar's proprietary small molecule polymer conjugate technology and its potential differentiating properties are inherent to its molecular design. In June of 2012, the U.S. Food and Drug Administration (FDA) granted Fast Track Designation to NKTR-181 for the treatment of moderate to chronic pain.
A Phase 1 clinical program for NKTR-181 has been completed in approximately 160 healthy volunteers. These studies showed that NKTR-181 produced sustained and dose-dependent analgesic responses with twice-daily dosing over a period of 8 days. These studies also measured the contraction of pupils over time following dosing with NKTR-181 and the data confirmed that NKTR-181 has a slow rate of entry into the CNS (central nervous system). This slow rate of entry is designed to reduce the euphoria that can lead to abuse and addiction to current opioid analgesics.1
Analyst Call to be Held 10:00 AM Pacific Time/1:00 PM Eastern Time on Wednesday, June 19, 2013
The company will be hosting a call to discuss these data with analysts and investors at 10:00 AM Pacific time/1:00 PM Eastern time today. Hosting the call will be Howard Robin, President and CEO of Nektar, and Robert Medve, MD, Chief Medical Officer. Joining company management will be Sidney H. Schnoll, MD, PhD of PinneyAssociates, an internationally recognized expert in addiction and pain management.
A live audio-only Webcast of the conference call can be accessed through a link that is posted on the home page and Investor Relations section of the Nektar website: http://www.nektar.com. To access the conference call live, follow these instructions:
Dial: (877) 881-2183 (U.S.); (970) 315-0543 (international)
|
Passcode: 97974070 (Nektar Therapeutics is the host)
|
The webcast replay of the conference call will be available through June 24, 2013.
About Opioids and Pain Management
Pain is one of the most common reasons people seek medical treatment.1 The American Pain Society estimates that 36 percent of the U.S. population, or 105 million people, suffer from chronic pain in the United States. Chronic pain conditions, such as osteoarthritis, back pain and cancer pain, affect at least 126 million adults in the U.S. annually and contribute to over $100 billion a year in direct healthcare expenditures and lost work time.3 Opioids are considered the most effective therapeutic option for pain, with sales exceeding over $10 billion a year in the U.S. alone.4,5 However, opioids can cause serious side effects such as respiratory depression and sedation and have the potential for addiction, abuse and misuse. In 2010, the Centers for Disease Control and Prevention (CDC) reported that emergency room visits for non-medical use of opioid analgesics increased 111 percent over a five-year period.6
About Nektar
Nektar Therapeutics is a biopharmaceutical company developing novel therapeutics based on its PEGylation and advanced polymer conjugation technology platforms. Nektar has a robust R&D pipeline of potentially high-value therapeutics in oncology, pain and other therapeutic areas. In the area of pain, Nektar has an exclusive worldwide license agreement with AstraZeneca for naloxegol (NKTR-118), an investigational drug candidate, which has completed Phase 3 development as a once- daily, oral tablet for the treatment of opioid-induced constipation. This agreement also includes NKTR-119, an earlier stage development program that is a co-formulation of naloxegol and an opioid. NKTR-181, a novel mu-opioid analgesic candidate for chronic pain conditions, is in Phase 2 development in osteoarthritis patients with chronic knee pain. NKTR-192, a novel mu-opioid analgesic in development to treat acute pain is in Phase 1 clinical development. In oncology, etirinotecan pegol (NKTR-102) is being evaluated in a Phase 3 clinical study (the BEACON study) for the treatment of metastatic breast cancer and is also in Phase 2 studies for the treatment of ovarian and colorectal cancers. In anti-infectives, Amikacin Inhale is in Phase 3 studies conducted by Bayer Healthcare as an adjunctive treatment for intubated and mechanically ventilated patients with Gram-negative pneumonia.
Nektar's technology has enabled eight approved products in the U.S. or Europe through partnerships with leading biopharmaceutical companies, including UCB's Cimzia® for Crohn's disease and rheumatoid arthritis, Roche's PEGASYS® for hepatitis C and Amgen's Neulasta® for neutropenia. Additional development-stage products that leverage Nektar's proprietary technology platform include Baxter's BAX 855, a long-acting PEGylated rFVIII program, which is in Phase 3 clinical development.
Nektar is headquartered in San Francisco, California, with additional operations in Huntsville, Alabama andHyderabad, India. Further information about the company and its drug development programs and capabilities may be found online at http://www.nektar.com.
Cautionary Note Regarding Forward-Looking Statements
This press release contains "forward-looking statements" within the meaning of the Private Securities Litigation Reform Act of 1995. Forward-looking statements can be identified by words such as: "anticipate," "intend," "plan," "expect," "believe," "should," "may," "will" and similar references to future periods. Examples of forward-looking statements include, among others, statements we make regarding the potential for NKTR-181 as a potentially new opioid therapy with reduced abuse potential, and the value and potential of our technology and drug candidates in our research and development pipeline. Forward-looking statements are neither historical facts nor assurances of future performance. Instead, they are based only on our current beliefs, expectations and assumptions regarding the future of our business, future plans and strategies, anticipated events and trends, the economy and other future conditions. Because forward-looking statements relate to the future, they are subject to inherent uncertainties, risks and changes in circumstances that are difficult to predict and many of which are outside of our control. Our actual results may differ materially from those indicated in the forward-looking statements. Therefore, you should not rely on any of these forward-looking statements. Important factors that could cause our actual results to differ materially from those indicated in the forward-looking statements include, among others, (i) NKTR-181 is in the earlier stages of clinical development and could fail at any time due to numerous unpredictable and significant risks related to safety, efficacy and other important findings that can negatively impact clinical development; (ii) although we have conducted various experiments using laboratory and home-based chemistry techniques that have so far been unable to convert NKTR-181 into a rapid-acting, more abusable opioid, it is possible that an alternative chemistry technique or process may be discovered in the future that would enable the conversion of NKTR-181 into a more abusable opioid; (iii) the statements regarding the therapeutic potential of NKTR-181 as an opioid analgesic are based on preclinical data and data from Phase 1 clinical studies and results from future clinical studies, including the ongoing placebo-controlled Phase 2 efficacy clinical study for NKTR-181, may fail to confirm these earlier analgesic findings; (iv) scientific discovery of new medical breakthroughs is an inherently uncertain process and the future success of the application of Nektar's technology platform to potential new drug candidates such as NKTR-181 is therefore very uncertain and unpredictable and could unexpectedly fail at any time; (v) patents may not issue from our patent applications for NKTR-181, patents that have issued may not be enforceable, or additional intellectual property licenses from third parties may be required; and (vi) certain other important risks and uncertainties set forth in our Quarterly Report on Form 10-Q filed with the Securities and Exchange Commission onMay 9, 2013. Any forward-looking statement made by us in this press release is based only on information currently available to us and speaks only as of the date on which it is made. We undertake no obligation to update any forward-looking statement, whether written or oral, that may be made from time to time, whether as a result of new information, future developments or otherwise.
Nektar Investor Inquiries:
| |
Jennifer Ruddock/Nektar Therapeutics
|
(415) 482-5585
|
Susan Noonan/SA Noonan Communications, LLC
|
(212) 966-3650
|
Nektar Media Inquiries:
| |
Marisa Borgasano
|
(781) 684-0770
|
(1) Hyman, Steven E., Harvard Review of Psychiatry. 2(1):43-46, May/June 1994.
(2) Source: January 2013 Guidance for Industry: Abuse-Deterrent Opioids – Evaluation and Labeling – Draft Guidance distributed by the U.S. Department of Health and Human Services, Food and Drug Administration, Center for Drug Evaluation and Research (CDER)
(3) 2011 National Academy of Sciences. Relieving Pain in America: A Blueprint for Transforming Prevention, Care, Education and Research, 2010 Decision Resources, and Harstall, C. How prevalent is chronic pain? Pain Clinical Updates X, 1—4 (2003).
(4) IMS, NSP, NPA and Defined Health 2010 Estimates.
(5) Melnikova, I, Pain Market, Nature Reviews Drug Discovery, Volume 9, 589-90 (August 2010).
(6) Morbidity and Mortality Weekly Report (MMWR), Emergency Department Visits Involving Nonmedical Use of Selected Prescription Drugs --- United States, 2004—2008, 59(23);705-709 (June 2010).
SOURCE Nektar Therapeutics
Link:http://money.msn.com/business-news/article.aspx?feed=PR&date=20130619&id=16612826
Link:http://money.msn.com/business-news/article.aspx?feed=PR&date=20130619&id=16612826
Huge Potential But Tough Entry For Female Sexual Dysfunction Drugs
By Brian L. Wilson - Disclosure: I have no positions in any stocks mentioned, and no plans to initiate any positions within the next 72 hours.
Currently there is a transdermal testosterone product for FSD available that was developed by Watson Pharmaceuticals along with partnerProcter & Gamble (NYSE: PG) which is sold in Europe, although the drug never made it to FDA approval and had its NDA withdrawn in 2004 due to concerns over its safety data. Another big attempt by the US market by Boehringer Ingelheim Pharmaceuticals with the drug that was commonly referred to as "Pink Viagra" fell flat on its face in 2010 after the company failed to convince the FDA of the utility of the product. In more recent history, we saw the failure of the testosterone gel known as "Libigel" hurt shares of BioSante Pharmaceuticals (NASDAQ: BPAX) at the end of 2011 after the placebo arm outperformed the Libigel arm in a phase III study.
Despite all of the trouble that companies have had in the past in their attempts at the US FSD market, the unmet need (and monetary potential) remains up for the taking. Investors who are familiar with the space are now looking at other FSD drug developers that have a shot at FDA approval.
One of the leading candidates in the space is Palatin (NYSE: PTN),which anticipates the start of a Phase III trial later this year. The Company is testing bremelanotide, a peptide melanocortin receptor agonist, in patients with FSD. Bremalanotide works via activation of melanocortin receptors in the central nervous system, and is intended for on-demand use approximately an hour prior to anticipated sexual activity. In the first quarter of 2013, Palatin released top-line data for their Phase IIb, at-home clinical trial in patients with female sexual dysfunction. The trial was a randomized, double-blinded study testing the safety and efficacy of bremalanotide in almost 400 patients with FSD. The patients were separated into one of four trial groups and received bremalanotide at 0.75 mg, 1.25 mg, 1.75 mg, or placebo. Patients self-administer via a single sub-cutaneous dose prior to an anticipated sexual encounter.
The trial hit on the primary and key secondary endpoints, a major success, demonstrating a good safety profile for bremalanotide and statistically significant increases in the number of Satisfying Sexual Events (SSE) versus placebo. The most common adverse reactions with incidence over 5% among bremalanotide users at any dose included nausea, flushing and headache. The FDA approved a Phase III trial design with bremalanotide, and the company could start the trial as early as Q4 2013.
Palatin is in good financial shape with $32.9 million in cash at the end 2012. With a cash burn rate of approximately $12 million per year, the company can readily fund its operations through FY2014, including the upcoming Phase III trial. With a market capitalization of about $24 million, shares of Palatin are actually trading below the value of cash on hand, so this may be a very attractive entry point for investors who want exposure to a potentially successful FSD drug development program.
Also promising for Palatin is the notion that there are no strong competitors in the FSD space. As mentioned earlier, BioSante Pharmaceuticals announced very poor results from two Phase III trials with their candidate LibiGel in 2011. These trials did not achieve statistical significance, forcing the company to temporarily step back from the program. While the company has not officially abandoned the Libigel program, it's difficult to see how they will overcome the problem of the extremely high placebo response.
Palatin's program is differentiated from BioSante's failed effort because bremalanotide uses a specific MOA directly affecting FSD, while BioSante is simply making another testosterone gel.
The Takeaway
Female Sexual Dysfunction is a huge unmet need in the United States, although the companies that have made attempts on this drug indication in the past have been unsuccessful. Currently, there are only a handful of companies with drug development plans that target this indication. Some are better than others. BioSante's Libigel, which is just another testosterone gel, doesn't look as likely to succeed while Palatin's melanocortin receptor agonist bremalanotide and also Apricus' topical prostaglandin agonist Femprox look more interesting.
"Previous year, Intel,Yahoo and HP announced a joint test centre for cloud computing education and reasearch. Last August IBM announced a $360m data center in North Carolina to provide Cloud Computing facility to their clients."
Top Cloud Computing Companies List To Watch and Invest in 2013
So Who Are the Top Cloud Computing Companies Today?
Here in the Southern India the sky seems quite clear yet the web is getting filled up everywhere with clouds.Yes waiting to get your hands on cloud computing? Well it's already there with you!There is a lot of confusion because everyone is tagging what they do with the word 'cloud'.It's a buzzword for the moment.Suddenly, certification courses on Cloud Computing have also started sprouting up everywhere.
However the general meaning is that your stuff is simply thrown out in the Internet rather than being stored on your laptop or server.Thus your data wont be lost even if your laptop is stolen by secret agents or the server had been destroyed by a missile.You can always access it back in the web from anywhere.A good example is the Google docs, the word processor included with it.Google has designed their Chrome browser, which acts itself as a google homepage. Several other Cloud Computing Companies have now rolled out their services to organizations around the globe.
Free Cloud Storage!
If you'd like to have a basic taste of cloud computing then you can check out the free service of Dropbox. Dropbox is software that syncs your files online and across your computers.Put your files into your Dropbox on one computer, and they'll be instantly available on any of your other computers online. Storage upto 2 GB if free you can upgrade if necessary at a later time.
Amazon Web Services

Finding the best Cloud Computing Companies to Invest in 2013
The Google's under-development Chrome OS termed Chromium is also aimed at dominating the cloud.It is said to be designed for users who always want to be online.Only the apps supported by them can be used by the client.It would be just like an Auto-Update which you can't turn off.
The cloud fever has hit other techno-gaints also. Previous year, Intel,Yahoo and HP had announced a joint test centre for cloud computing education and research. Last August IBM announced a $360m data center in North Carolina to provide Cloud Computing facility to their clients.
Anyhow, all are not happy about the clouds. Richard Stallman, the founder of Free Software Foundation and the GNU operating system creator, says that the cloud computing is simply a trap aimed at forcing more people to buy into locked, proprietary systems that would cost them more and more over time.But as all the leading companies like IBM,Amazon,Googl,Yahoo & HP have taken their initiative it's a doubt weather the industries can resist their urge to join the cloud for much long. By 2014 cloud computing compines are expect to grow rapidly. This article will be also useful for potential investors carfully watching the best cloud companies to invest in 2013.
Top cloud computing companies list.
Amazon - Amazon Web Services (IaaS)
The cloud computing company of Amazon.com : Amazon Web Service(AWS) provide Infrastructure-as-a-service(IaaS) offerings in the cloud for organizations requiring computing power,storage, and other services.
- Elastic Compute Cloud(EC2)
EC2 is a web service that allow resizable compute capacity in the cloud.The customers can create virtual machines (VMs)-that is ,server instances called Amazon Machine Image (AMI)- on which the customer can load any softaware of his choice.They follow pay-by-the hour system.
- Simple Storage Service(S3)
S3 provide a web service interface that can be used to store and retrived unlimited amounts of dat, at any time, from anywhere thru the Internet.
Google Cloud Computing Unit : App Engine
Google ZOHO

Google (SaaS,PaaS)
Google App Engine is Google's platform-as-a-service(Paas) offers building and hosting web applications on the Google Infrastructure.Currently Python and Java are the supported programming languages.App Engine is free up to a certain level of resource used.Fee is charged for additional storage, bandwidth, or CPU cycles required by the application.
Software-as-a-servive (SaaS) offers business email and collaboration.Its similar to the traditional office suits, includin Gmail, Calendar, Talk, Docs and Sites.
Microsoft Azure Service Platform(PaaS)
Azure Service Platform is Microsoft's PaaS offering an operating system called Windows Azure that serves as a runtime for the applications and provides a set of services such as:
.NET Services, SQL Services, Live Services
Microsoft - Cloud Computing

Rackspace (Cloud Hosting)
Is one of the premier cloud computing companies that leads cloud hosting. They serve over 10000 companies and many of the Fortune 100 companies come under this huge list. Their unique customer service strategy named - Fanatic support have helped them in gaining the trust of their clients. With the huge client commitment and state-of- the art technology. Rackspace is one good cloud computing company to invest in.
Proofpoint (SaaS,IaaS)
Proofpoint provides SaaS and IaaS services in the cloud related to securing the enterprise email infrastruture, with solutions .Proofpoint's solutions are priced on a per-user, per-year basis,depending on the product features.
RightScale(IaaS)
RightScale provides IaaS-Related services in the cloud to assist organizations in managing cloud deployments offered by other CSPs, including vendors such as AWS,FlexiScale, and GoGrid.The Rightscale Cloud Management Platform allows organizations to manage and maintain their cloud deployment through one web-based management platform.
Salesforce.com(SaaS,PaaS)
Salesforce is a provider of SaaS-based products, as well as having a PaaS offering, Force.com.
Sun Open Cloud Platform
According to Sun, the Open Cloud Platform is an open architecture and infrastructure encompassing technologies such as Java, MySQL,OpenSolaris, and Open Storage software.
Workday (SaaS)
Workday is a provider of SaaS-based hum resources and financial management products.Workday pricing is on a per-user basis and functionality.Workday's solutions are divided into serveral modules like Human Capital Management, Payroll, Worker Spend Management, Financial Management et cetra.In the collection of such companies the ones which provide Cloud Compuing in IaaS cloud are the most On-demand in the market today!
Uni-Pixel: Possibly The Best Investment For 2013
December 31, 2012 | about: UNXL, includes: CCEGF.PK
By Chris Heffmann : Disclosure: I am long UNXL.
This article is about Uni-Pixel (UNXL), which is currently trading at $10.60 and has the potential to break $100 within the next 12 months based on expected growth. In order to educate unfamiliar and experienced investors, it is broken into three sections: Background, Opportunity, and Risk. My goal is to lay out the facts as plainly as possible as I have done a significant amount of due diligence in this stock. I have attempted to source all information whenever possible, and am open to questions/comments/concerns in the section below.
Background (largely sourced from: MDB Unipixel)
In order to fully understand Unipixel's opportunity, one must first understand the market - touch screens. A touch module is comprised of several different components: a cover lens, a conductive layer, the display, and a touch controller (this is the chipset inside the device). UniBoss belongs to the conductive layer.
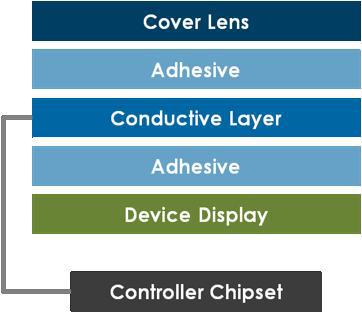
The current touch screen market is estimated to be about $10B and it is expected to grow to nearly $32B by 2018. Of this, the conductive layer is approximately $27 million. This is the potential market for UniBoss. (Touch Market Size). This growth is through smart phones, tablets, laptops, and essentially every other screen input device.
Current 'conductive layers' are made from ITO (Indium Tin Oxide) which is horribly flawed. Firstly, Indium is expensive, increasing from $300/kg to $800/kg in the past 3 years. Indium is a rare earth metal, mostly found in China, and it is expected to be near depleted by 2020. ITO is also very difficult to work with as it is very brittle and expensive to manipulate. All of this causes ITO conductive layers to cost about $4.05 for an iPhone, which is about ¼ of the total cost of the touch unit. Due to the brittleness of ITO, this cost gets exponentially more expensive for larger screens (such as tablets or laptops, or larger smart phones).
This is where Unipixel steps in with the UniBoss product. UniBoss utilizes metal-mesh technology by creating a 'net' of extremely thin copper wires (5 microns thick). This net is so thin, that it is invisible to the naked eye. One of the biggest advantages of UniBoss over ITO is that it uses copper, which costs a mere $8/kg, thus lowering the cost per smartphone from $4.05 to $2.50. This is a savings of over 35% at the smartphone size. Unlike ITO, UniBoss scales very well into larger screens, allowing for significantly higher savings for tablets and laptops.
But price isn't the only benefit of UniBoss. It also uses 75% less power, reduces resistance by 2000x, increases scan rates by 10000x and reduces latency to less than 1 millisecond (UniPixel Brochure)
Another advantage of UniBoss is that it is an additive process as opposed to subtractive. Most performance printing manufacturing will cover the entire film with substrate and then scrape off the parts they don't need. This creates a huge amount of waste (cost inefficient). UniBoss is a roll-to-roll additive process which is much more cost efficient.
Finally, there is a labor reduction advantage. Current manufacturing techniques take about 40 steps to complete, whereas UniBoss' manufacturing takes 8 steps.
Opportunity
It should be clear that UniBoss is definitely better than ITO based touch screens. They have a cost and performance advantage. It is win-win vs. ITO. But what have they done so far?
So far Unipixel has achieved four design wins with customers in the tablet/notebook space. One of these signed a deal in early December (rumored to be Dell (DELL)). They also have strong partnerships with N-Trig, a leading touch module manufacturer, Texas Instruments (TXN) (yes, the huge company), two additional unnamed controller manufacturers, and Carestream (this is mostly for DiamondGuard). Unipixel is fully qualified with Texas Instruments' touch controller module and the company has repeatedly mentioned that they will be making an announcement 'soon'. It is theorized that they are waiting for TI's contract with Apple to expire in January. It is expected that Unipixel's products would be seen on products hitting shelves in 2H 2013.
The following quote from CEO Reed Killion summarizes the benefits of the Texas Instruments deal:
With Texas Instruments it is basically a working collaboration with their controllers… They have an exclusive deal with [Apple] that ends at the end of 2012… they are introducing stand alone controllers that should be one of the better performing controllers out there. It is a unique opportunity to work with them and we have a very good relationship with them. It will be a joint sales and marketing relationship and we may utilize it to expand into some of our other areas of expertise as well.
Unipixel is in discussions with many other companies as well for more design wins, and I believe it is safe to assume they will receive another 1-3 wins per quarter in 2013. But what does all of this mean for profits? Two days before the announcement with their first purchaser (possibly Dell), the company announced in an analyst call that they expect to produce 60,000 units/month by the end of Q1 2013, 175,000 units/month by the end of Q2, 700,000 units/month by the end of Q3, and 1.3 million units/month by the end of 2013. They have a preferred pricing program at $20 per unit, and expect to have "greater than 50% margins" on this preferred pricing.
They have no debt, $15 million in cash, and $500k / month in operating expenses. This can be put together in a simple chart as follows:
Low
|
Med
|
High
| ||
2013
|
Units Sold
|
400,000
|
800,000
|
1,200,000
|
2014
|
Per Month
|
800,000
|
1,500,000
|
2,000,000
|
2015
|
1,500,000
|
2,000,000
|
3,000,000
| |
2013
|
Preferred
|
$20
|
$20
|
$20
|
2014
|
Pricing
|
$20
|
$20
|
$20
|
2015
|
$20
|
$20
|
$20
| |
2013
|
Sales
|
96,000,000
|
192,000,000
|
288,000,000
|
2014
|
192,000,000
|
360,000,000
|
480,000,000
| |
2015
|
360,000,000
|
480,000,000
|
720,000,000
| |
2013
|
Margins
|
48,000,000
|
96,000,000
|
144,000,000
|
2014
|
50.0%
|
96,000,000
|
180,000,000
|
240,000,000
|
2015
|
180,000,000
|
240,000,000
|
360,000,000
| |
2013
|
Oper
|
20,000,000
|
15,000,000
|
12,000,000
|
2014
|
Exp
|
23,000,000
|
17,250,000
|
13,800,000
|
2015
|
26,450,000
|
19,837,500
|
15,870,000
| |
2013
|
profit
|
28,000,000
|
81,000,000
|
132,000,000
|
2014
|
73,000,000
|
162,750,000
|
226,200,000
| |
2015
|
153,550,000
|
220,162,500
|
344,130,000
| |
2013
|
Tax
|
7,000,000
|
20,250,000
|
33,000,000
|
2014
|
25%
|
18,250,000
|
40,687,500
|
56,550,000
|
2015
|
38,387,500
|
55,040,625
|
86,032,500
| |
2013
|
Net income
|
21,000,000
|
60,750,000
|
99,000,000
|
2014
|
After Tax
|
54,750,000
|
122,062,500
|
169,650,000
|
2015
|
115,162,500
|
165,121,875
|
258,097,500
| |
Shares
|
13,500,000
|
13,500,000
|
13,500,000
| |
2013
|
EPS
|
1.56
|
4.50
|
7.33
|
2014
|
4.06
|
9.04
|
12.57
| |
2015
|
8.53
|
12.23
|
19.12
| |
Low
|
Medium
|
High
| ||
2013
|
31
|
90
|
147
| |
2014
|
81
|
181
|
251
| |
2015
|
171
|
245
|
382
|
The company has detailed during conference calls that they expect operating expenses will increase to $1 million per month at full capacity, which I have used for the 'high' scenario. I am also assuming 25% tax rate even though the company probably won't have to pay taxes for the first year. I have assumed a relatively conservative PE of 20, although companies with this sort of growth usually carry significantly higher PEs. If they are able to do just 400k units per month in 2013, that should equate to about $30/share, whereas if they fully utilize at 1.3 million units per month it could get into the triple digits ($147/share). This enormous difference between $30 and $147 is due to the small number of shares outstanding - fully diluted at 13.5 million. However, keep in mind that even on the high end we are discussing sales of only $288 million by the end of 2013, which is a tiny fraction of the $32B touch screen market.
It would be tough to argue that the sky isn't the limit for Unipixel. And with the first deal already under their belt, the downside seems miniscule. The first deal alone, with zero future growth, should easily be able to maintain a $15-$20 share price, potentially much more.
Risks
As with all companies, the risks do exist. There are many other companies creating other alternatives to ITO. Here is a brief list of other technologies and why I do not believe they will be as successful as copper metal mesh:
Optical: Optical technologies use an array of led lights to detect movement. This is similar to Neonode (NEON), NextWindow, and Flatfrog. This technology tends to have great latency, and doesn't require the electric touch of a finger, and can therefore be used with gloves, a pencil, or any other tool. However, it also requires a small bezel around the screen to house the led lights which is very difficult on smart phones and unattractive on tablets. Because of this cosmetic issue, I do not believe it will be a major competitor.
Silver Nanowire: This is similar to UniBoss' copper metal mesh, but it utilizes silver instead. Silver is actually more conductive than copper, giving it outperformance. However, silver is more expensive and difficult to work with, and researchers have not yet been able to make use of its full ability. Two companies in this field are Cambrios and Carestream.
PEDOT Films: PEDOT PSS is a polymer that has electrical conductivity, which is rolled onto the substrates. However, it is not as conductive as copper, it isn't very stable, and it tends to break down even more easily than ITO. The market leader is Heraeus, along with Agfa and Plextronics.
Graphene: Graphene has tremendous capabilities, but it is essentially in the 'alpha' stage of research. However it is very sensitive to defects, so it would most likely need to be used in conjunction with another material. While graphene may be the eventual replacement to copper metal mesh, it won't happen for at least 5-10 more years (conservatively).
This brings us to other Copper metal mesh companies. There is really only one direct competitor to Unipixel, and that is Carclo (CCEGF.PK), through its CIT (Conductive Inkjet Technology) division. Carclo has a deal with Atmel, the $2.5 billion company which currently has a deal with Samsung. It is well understood that Unipixel has developed a better product than Carclo that is easier to manufacture, cheaper and slightly more efficient. Also, the market is plenty big for both of them. However, Carclo is clearly threatened as they recently sued Unipixel (Suit and Counter), specifically mentioning: "CIT is seeking injunctive relief against Uni-Pixel to deprive it of the unfair head-start in its development efforts which CIT believes it to have gained from unauthorized use of CIT know-how, plus damages" (emphasis added).
This is the major threat to Unipixel, and it is what (I believe) is keeping a few buyers away. However, Unipixel argues that there is no substance to this suit whatsoever, and based on my research, Unipixel is correct. From what I have been able to dig up, the facts are these:
About 5 years ago Carclo and Unipixel worked on a project together involving optics and metallization. Nothing really amounted of their work together and they sold some of their results to Rambus (RMBS). Now, Carclo is suing Unipixel because they believe that Unipixel is using technology that they worked on together and Carclo therefore owns. However, the optics part is unrelated to UniBoss, and Unipixel actually outsourced the metallization part (page 18 from very first link sourced above). Unipixel is happy to go to court over this matter and has hired Fish & Richardson, the #1 IP firm in the US for 9 years in a row, to defend them. Also, Unipixel currently holds numerous patents for their UniBoss technology and are in the process of applying for other patents.
While both touch screen processes are additive, the steps are very different as Carclo uses Inkjet printing and UniBoss doesn't. For example, one of the advantages of UniBoss is that they are able to print 50 feet per minute, whereas Carclo only prints 20 feet /minute, a 60% difference.
Conclusion
In conclusion, I believe that Unipixel has created a better mousetrap in a growing market. If they are able to make the correct relationships, which they are in the process of doing with N-Trig, Carestream, and Texas Instruments, the sky is the limit for their growth. Most importantly, they have already received their first major win in early December, validating their technology, their company, and putting a floor beneath their stock price. Major investors include institutions such as Bank of America, Fidelity (through Pyramis), and Wellington Management, as well as 'legendary' investor Kevin Douglas. Only two analysts cover the stock so far, (both with $20+ price targets), but I expect many more to jump in as the company becomes more well known throughout 2013. I highly recommend buying UNXL.
Source: seekingalpha.com
4 Stocks Expected to Double Sales in 2013
By Michael Vodicka
Published 12/17/2012 - 11:30
After the financial and economic implosion of 2008, many companies were forced to implement drastic operational changes to stay competitive and profitable. That included increasing productivity, reducing labor resources and lowering capital spending to build cash and liquidity. These strategies had a big effect on earnings, and now the S&P 500 is on the cusp of returning to peak earnings last seen in 2007.
 #-ad_banner-#But while that big rebound in earnings has been great for stocks (the S&P 500 has more than doubled from its low in March 2009) it also has the private sector sitting at the top of a multi-year expansion in margins and record profitability.
Take Coca-Cola Co. (NYSE: KO [1]), for example. The company's operating margin exploded higher out of the recession in 2009 all the way through 2011, climbing from a 10-year average of 21% to an all-time high above 33% in July of 2011.
What Coke and other big companies found out during the recession is that they could get by with fewer labor resources and increase earnings through simple margin expansion. But now, that three-year margin cycle is showing signs of topping off.
Highland Mint OBAMAINAUGK Barack Obama Presidential Inauguration 24KT Gold Coin (Google Affiliate Ad)
If even big companies like Coca-Cola are struggling to expand margins any further, then mid and small caps -- which have less pricing power -- are in even deeper trouble. These companies and executives have squeezed everything they can out of spending and labor costs, so future earnings growth will have to be driven by new revenue. The thing is, mid- and small-cap companies have more room to growh, so they are able to post stronger gains than slow-growing blue chips.
Therefore, to enjoy the highest possible returns next year, investors should be focusing on mid- and small-cap stocks with strong projected revenue growth. Here are four companies that fit the bill, with expected sales growth of more than 100% in 2013.
1. Ocwen Financial Corp. (NYSE: OCN [2])
Market cap: $3.6 billion
Projected sales growth: 103%
Ocwen Financial services residential and commercial loans in the United States and internationally. With housing showing big signs of improvement in 2012, Ocwen's share price has rallied 143% on the year. That bullish movement has been driven by surging estimates, with the full-year 2013 earnings jumping an eye-popping 208% to $4.50 a share from 90 days ago. Projected sales growth isn't far behind, with analysts calling for revenue to increase 103% in 2013, reaching almost $1.7 billion.
 2. W.P. Carey Inc. (NYSE: WPC [3])Market cap: $3.35 billionProjected sales Growth: 110%
W.P. Carey is a global real estate investment trust (REIT). This stock has been having a great year, with shares up 17% in 2012, which is a solid performance compared with the S&P 500's 12% return. Analysts have recently become more bullish on the company, with the current-year earnings estimate climbing 6% in the last 90 days to $3.51 a share. Next-year's earnings estimate also rose -- about 12% -- to $3.88 a share, a solid 10.5% growth projection. In addition, analysts are looking for year-over-year sales to more than double from $150 million to $314 million. And if the company's forward price-to-earnings (P/E) ratio of 14 is returned to the industry average of 16, then shares would jump another 14%.
 3. Endeavour International Corp. (NYSE: END [4])Market cap: $256 millionProjected sales growth: 138%
With a market cap of just $256 million, this is a much more speculative stock than the previous two companies. This oil and gas exploration company has suffered the fate of many other energy companies in 2012, with shares down 30% on the year. The company is on pace for a loss in 2012, but analysts are projecting a big turnaround in 2013, calling for earnings of $1.02 a share, up from a projected loss of $2.84 a share in 2012. That big gain is being fueled by sales growth, with analysts calling for a 138% increase in revenue next year.
 4. Allied Nevada Gold Corp. (NYSE: ANV [5])
Market cap: $2.75 billion
Projected sales growth: 161%
Allied Nevada Gold is a gold and silver miner that operates primarily in Nevada. Although Allied has been mostly flat in 2012, with shares down 0.3% on the year, the stock is up an astounding 460% in the past five years as gold and silver prices have hit new multi-year highs. The company is extremely profitable, with analysts calling for earnings of $1.91 per share in 2013, a bullish 183% growth projection. Not far behind is projected sales growth, with analysts projecting revenue to climb an equally impressive 161%.
 Risks to Consider: Revenue gains do not always translate into earnings growth, because margin or financial restrictions also weigh in the balance sheet. Companies that increase sales quickly can also be susceptible to sharp declines in sales, as market conditions change.
Action to Take --> These four companies are expected to double their revenue in 2013. This will put them in a great position for big earnings growth. The fact that some of these stocks are being under pressure this year, makes them great picks for value investors in search for next year's best potential gainers.
--Michael Vodicka
Take Coca-Cola Co. (NYSE: KO [1]), for example. The company's operating margin exploded higher out of the recession in 2009 all the way through 2011, climbing from a 10-year average of 21% to an all-time high above 33% in July of 2011.
What Coke and other big companies found out during the recession is that they could get by with fewer labor resources and increase earnings through simple margin expansion. But now, that three-year margin cycle is showing signs of topping off.
Highland Mint OBAMAINAUGK Barack Obama Presidential Inauguration 24KT Gold Coin (Google Affiliate Ad)
If even big companies like Coca-Cola are struggling to expand margins any further, then mid and small caps -- which have less pricing power -- are in even deeper trouble. These companies and executives have squeezed everything they can out of spending and labor costs, so future earnings growth will have to be driven by new revenue. The thing is, mid- and small-cap companies have more room to growh, so they are able to post stronger gains than slow-growing blue chips.
Therefore, to enjoy the highest possible returns next year, investors should be focusing on mid- and small-cap stocks with strong projected revenue growth. Here are four companies that fit the bill, with expected sales growth of more than 100% in 2013.
1. Ocwen Financial Corp. (NYSE: OCN [2])
Market cap: $3.6 billion
Projected sales growth: 103%
Ocwen Financial services residential and commercial loans in the United States and internationally. With housing showing big signs of improvement in 2012, Ocwen's share price has rallied 143% on the year. That bullish movement has been driven by surging estimates, with the full-year 2013 earnings jumping an eye-popping 208% to $4.50 a share from 90 days ago. Projected sales growth isn't far behind, with analysts calling for revenue to increase 103% in 2013, reaching almost $1.7 billion.
W.P. Carey is a global real estate investment trust (REIT). This stock has been having a great year, with shares up 17% in 2012, which is a solid performance compared with the S&P 500's 12% return. Analysts have recently become more bullish on the company, with the current-year earnings estimate climbing 6% in the last 90 days to $3.51 a share. Next-year's earnings estimate also rose -- about 12% -- to $3.88 a share, a solid 10.5% growth projection. In addition, analysts are looking for year-over-year sales to more than double from $150 million to $314 million. And if the company's forward price-to-earnings (P/E) ratio of 14 is returned to the industry average of 16, then shares would jump another 14%.
With a market cap of just $256 million, this is a much more speculative stock than the previous two companies. This oil and gas exploration company has suffered the fate of many other energy companies in 2012, with shares down 30% on the year. The company is on pace for a loss in 2012, but analysts are projecting a big turnaround in 2013, calling for earnings of $1.02 a share, up from a projected loss of $2.84 a share in 2012. That big gain is being fueled by sales growth, with analysts calling for a 138% increase in revenue next year.
Market cap: $2.75 billion
Projected sales growth: 161%
Allied Nevada Gold is a gold and silver miner that operates primarily in Nevada. Although Allied has been mostly flat in 2012, with shares down 0.3% on the year, the stock is up an astounding 460% in the past five years as gold and silver prices have hit new multi-year highs. The company is extremely profitable, with analysts calling for earnings of $1.91 per share in 2013, a bullish 183% growth projection. Not far behind is projected sales growth, with analysts projecting revenue to climb an equally impressive 161%.
Action to Take --> These four companies are expected to double their revenue in 2013. This will put them in a great position for big earnings growth. The fact that some of these stocks are being under pressure this year, makes them great picks for value investors in search for next year's best potential gainers.
--Michael Vodicka
This Stock Could Return 16% a Year For The Next 5 Years
 As I routinely do, I was recently searching for a hidden gem stock investment.
In other words, I was trying to identify a preverbal diamond in the rough.
As I was conducting my search, it suddenly occurred to me that if I wanted to find a jewel of an investment, I should look to where the most precious treasures would be found – so logically I “went to Jared.”
And in doing so, I discovered
Signet Jewelers Ltd. (SIG)
, a stock that has soundly outperformed the stock market since 2009.
Since changing its stock market listing from the London to the New York Stock Exchange on September 11, 2008, Signet Jewelers Ltd. has been on a tear.Operating earnings growth has averaged almost 23% a year, and the stock price has risen from $8.67 on December 31, 2008 to $55.14 on the close of business on December 12, 2012.
This has generated capital appreciation at a compounded annual rate of 59.7%, add in their modest dividend and annual shareholder returns have exceeded 60% per annum.
The following earnings and price correlated FAST Graphs™ and accompanying performance table reveals these results. Yet in spite of this stellar performance, Signet’s stock receives little to no coverage or attention from Wall Street.


Signet Jewelers Ltd A Branding Powerhouse
Signet is the largest specialty retail jeweler in the world. Since 2008, the company has been domiciled in Bermuda and their stock listed on the New York Stock Exchange. Signet dominates the specialty jewelry markets in both the United States and the United Kingdom. Much of this success can be attributed to their successful marketing and branding campaigns. See a woman smiling on TV and you almost immediately think “He went to Jared” and most everyone now knows that “Every Kiss, Begins with Kay.”

However, although great taglines can capture and even captivate customer mind share, it takes a great product offering to convert that into sales and profits. Signet does a stellar job of creating attractive offerings to differentiate their jewelry stores from their competition. The Leo Diamond, marketed as the only diamond certified to be brighter, the Open Hearts Collection by Jane Seymour and the Le Vian Chocolate Diamond Collection are just a few of the successful branding initiatives that distinguish the Signet jewelry franchises from all the rest.

But most importantly, all of these successful marketing and branding programs are backed by extensive research based on mining their proprietary database of over 25 million jewelry purchasers. Catchy taglines backed by a quality array of enticing collections are major contributors to Signet’s profitable growth and success.
Additionally, this experience is enhanced by a highly trained and dedicated staff. Every Signet district manager and vice president has at one time operated a store. Therefore, Signet’s highly trained staff of dedicated employees are motivated by the company’s strong promote from within policy, which adds up to a great customer experience and a very profitable business model.
Moreover, the company has no debt on their balance sheet, and can be purchased today at a below market PE ratio of 13.1. In January of 2008 the company’s gross margin was 10.6%, but as of January 2012 gross margin has increased to 38.3%. Net margin has increased from 5% to 8.7% over that same time frame.
Signet’s margins are significantly higher than major competitors such as Zale, and I believe is attributed to Signet’s excellent control of costs. Additionally, Signet possesses one of the industry’s most sophisticated management and inventory control systems in the industry.
As previously stated, Signet’s operating performance has been exceptional since 2008. operating earnings growth has been 22.9%, and the company has no debt on the balance sheet. Their fiscal third quarter results they reported on November 20, 2012 shows the company is continuing its strong performance.

Furthermore, the recent acquisition of the Chicago-based outlet diamond chain, Ultra Stores, thereby establishing a larger foothold into the outlet store market is expected to be accretive to earnings by the fourth quarter of fiscal 2014. This is a rapidly growing channel that Signet’s management believes will augment their long-term profitability.

Summary and Conclusions
Signet is a very strong jewelry retailer that is mostly being ignored regarding coverage and research. However, the company has generated excellent operating results, and the stock price has tracked those results since the company moved their listing to the New York Stock Exchange in 2008. However, it was the company’s creative branding and marketing over the holiday season that attracted me to wanting to know more about the parent company. What I discovered was a very pleasant surprise.
Consequently, I believe that Signet represents a very attractive total return opportunity at its current quotation. The company is dominant in its industry; and it appears to be currently very reasonably priced by the market place. The dividend yield is light, but growing rapidly, while capital appreciation potential appears to be significantly above-average going forward. Signet’s earnings yield is attractive at 7.8%.
Recently the stock price has momentum and I calculate current fair value at approximately $64.00 per share, and a long-term target price out to fiscal year-end 2018 at $114 per share, implying a five-year compound return potential of approximately 16% per annum. Therefore, I rate it a short and long-term buy.
– Chuck Carnevale
Analyst Actually Thinks Kodak's Stock Will Rise Over 400%
When news broke Wednesday that Eastman Kodak(EK_) is considering filing for bankruptcy protection, Rafferty Capital Markets analyst Mark Kaufman looked a bit foolish with a "buy" rating and $5.50 price target as the shares plunged below 50 cents.
 So, on Thursday, Kaufman made it up to those investors who follow his research. He downgraded Kodak to -- wait for it -- "hold" with a $2.75 price target. That implies the stock of a company that may file for Chapter 11 would rally more than five-fold over the next year.
The Wall Street Journal reported Wednesday that Kodak is preparing to seek bankruptcy protection as it continues to find buyers for some of its patent portfolio. If the last-ditch move to sell the patents fails, Kodak is making the preparations for the Chapter 11 filing, which includes asking banks for $1 billion in financing, the Journal reported.
But only a week ago, Kaufman came out with an endorsement for Kodak. He argued that the recent appointment of Laura Quatela to co-president "signals Kodak may be positioning itself for a major corporate restructuring to simultaneously unlock its asset value and provide added liquidity."
It turns out Kaufman was right about a structuring, but wrong in assuming it would be in the corporate offices. In his downgrade note released today, Kaufman argues that "a Chapter 11 bankruptcy would amount to a strategic maneuver, which perverse as it may seem, could actually preserve more value for all of Kodak's investment constituents including the equity than other options it is likely considering."
Kaufman's logic is that a Chapter 11 filing would allow Kodak to borrow more than the $600 million the company is currently allowed under debt indentures. He also argues that the $1 billion credit line from banks that the Journal reported would be more than ample liquidity for Kodak to survive 2012.
Still, Kaufman cut his rating on Kodak to "hold" and sliced his price target in half because of "the heightened uncertainty about the actual timing and manner of a digital patent portfolio transaction and/or other liquidity events." In doing so, Kaufman still argues that Kodak's asset values "are not likely to be impaired by a strategic Chapter 11 bankruptcy reorganization." In this case, it's all about the headline risk.
Kaufman isn't the only analyst with a "hold" rating on Kodak. Argus Research and Brean Murray also recommend holding on to shares of the company. The difference, though, is that those firms last made the "hold" call in November. Four other research shops covering Kodak all have "sell" ratings, including Citigroup and Deutsche Bank, which haven't updated investors on the company since early November.
It doesn't take a research analyst's call to get the real sentiment on Eastman Kodak, though. As one person tweeted yesterday in separate posts, "$EK filing Chapter 11 - this didn't happen 10 years ago???? Why were we not all short this stock a year ago? Just say it, dumb, lazy, what?"
That doesn't sound good for the prospects of a stock that rallies 500% in a year. And by the way, shares of Kodak are down another 12% today to 41 cents.
9 STOCKS UNDER $10 POISED TO MOVE HIGHER ( $10 -$20 ) IN 2012
| Sym | Sector/ Industry |
Mkt Cap |
Avg Vol |
Last Price | 52
Wk High |
52
Wk Low |
P/E |
|---|---|---|---|---|---|---|---|
| PRMW | Consumer Goods/ Food & Beverage |
72.80M | 601.70K | $3.01 | 16.45 | 2.50 | 1.45 |
| ACAD | Health Care/ Drugs |
57.02M | 219.00K | $1.11 | 3.30 | 0.90 | 2.57 |
| TSRX | Health Care/ Health Services |
206.17M | 104.40K | $6.93 | 9.00 | 3.55 | 55.00 |
| GILT | Technology/ Telecommunications |
162.19M | 57.50K | $4.06 | 5.89 | 3.04 | 4.54 |
| GNOM | Health Care/ Drugs |
90.26M | 346.60K | $2.90 | 18.55 | 2.57 | 0.06 |
| CMED | Health Care/ Health Services |
91.64M | 606.70K | $3.10 | 13.98 | 2.32 | 5.92 |
| DANG | Services/ Retail |
360.67M | 2.08M | $4.89 | 36.40 | 4.11 | 220.00 |
| PGNX | Health Care/ Drugs |
288.33M | 190.60K | $8.50 | 9.19 | 4.50 | 142.33 |
| DBLE | Basic Materials/ Energy |
77.08M | 106.00K | $6.61 | 12.00 | 4.80 | n/a |
1
Inside Wall Street: Amgen is the biotech to buy
Leadership changes at one of the world's largest and most underappreciated biotechs bode well for investors.
By Gene Marcial on Wed, Dec 28, 2011
 For investors seeking to participate in the increasingly growing but complex world of biotechs, Amgen (AMGN -0.65%) is the stock to buy for the coming year -- and for the long haul.
A pivotal event -- change in the company's leadership -- should entice investors to pick up shares now. The changes, which will occur by mid-2012, include chief executive Kevin Sharer's retirement on May 23. He will be succeeded by chief operating officer Robert Bradway. And the head of research and development , Roger Perlmutter, will retire on Feb. 12, to be replaced by chief medical officer Sean Harper.
The big shakeup isn’t a surprise to Wall Street, but it’s definitely a most welcome move. That’s because no matter how successfully the company has arduously navigated the intricate pathways of the complicated industry all these years to become one of the world’s largest biotech companies, Amgen has needed new leadership, according to analysts who know the enterprise well. Stiff competition in the drug industry and the constant need for new and better products have necessitated the changes at the top to secure fresh energy for new visionary leadership. Amgen is one of the handful of biotechs posting profits.
"We view the changes positively as we see Amgen as being in need of new leadership after several years of moderating results from legacy drugs, and earnings increasingly being supported by share buybacks," says Steven Silver, a drug analyst at Standard & Poor's. The changes didn't come as a surprise, because of the long tenure at Amgen of both Bradway and Harper, he adds. Bradway was added to the board earlier in 2011, which signaled his potential as the successor to Sharer.
The changes should in all likelihood renew attention to Amgen’s long-term drug pipeline and its cheap valuation even as the leadership changes have driven its stock higher. It has jumped just a whisker below its 52-week high of $63.85 a share, closing at $63.69 on Dec. 23, up from $58 on Dec. 16, when the changes were announced. But some analysts have a 12-month price target ranging from $69 to $79.
Amgen’s core product lineup can be described as mature products, but they include the world’s five best-selling biotech drugs, including Epogen, a genetically engineered hormone that stimulates the production of red blood cells in bone marrow, which generated total sales of $2.5 billion in 2010, and Neupogen, which stimulates production of white blood cells in cancer patients to prevent bacterial infection. Neupogen, along with another Amgen drug, Neulasta, also a white blood cell stimulant, produced sales of $4.84 billion last year.
The huge cash flow being generated by Amgen’s legacy drugs are sufficient to support dividends and share repurchases, says S&P analyst Silver, as well as the funding of R&D investments and acquisitions, such as the purchase in early 2011 of cancer vaccine maker BioVex. He adds that his buy recommendation on Amgen reflects his view that the recent rollout of Prolia, a drug for post-menopausal osteoporosis, and Xgeva, a treatment for skeletal-related issues in solid tumor cancer patients, will greatly enhance the stock’s value.
Prolia has other applications as well. In Europe, the drug was approved last year for the treatment of prostate cancer patients with bone loss due to hormone ablation. The company has applied with the FDA to approve the same use in the U.S. According to Silver, the FDA is expected to act on the application sometime in April 2012.
Amgen’s pipeline of new drug candidates is promising: Its AMG 386 for ovarian cancer and AMG 479 for pancreatic cancer are both in phase 3 clinical studies, as well as Oncovex, a drug for the treatment of melanoma and head-and-neck cancer. Amgen continues to collaborate or partner with big pharmaceutical companies to expand its reach. In December 2011, it signed a global agreement with Watson Pharmaceutical to develop and market oncology antibody drugs.
Michael J. Yee, analyst at RBC Capital Markets, concedes that Wall Street has low expectations from Amgen’s stock, but he says the bull case is that it "remains reasonably cheap," in part because the company is likely to forecast earnings for 2012 that are higher than consensus estimates. He also expects it to increase its dividend payments and continue share buybacks that he expects will amount to some $1 billion worth of stock in 2012. Amgen currently pays a dividend yield of 1.9%.
Rating the stock as outperform, he has a 12-month price target of $72 a share. Yee figures Amgen will earn $5.29 a share on revenues of $15.4 billion in 2011, and $5.94 in 2012 on sales of $15.9 billion. For 2013, Yee expects earnings of $6.40 a share on revenues of $16.4 billion.
True, Amgen isn’t among the top choices on Wall Street’s list of favored drug stocks, but that’s precisely one of the major reasons why the rewards will be much higher for this under-appreciated stock.
Inside Wall Street: Amgen is the biotech to buy
Leadership changes at one of the world's largest and most underappreciated biotechs bode well for investors.
For investors seeking to participate in the increasingly growing but complex world of biotechs, Amgen (AMGN -0.65%) is the stock to buy for the coming year -- and for the long haul.A pivotal event -- change in the company's leadership -- should entice investors to pick up shares now. The changes, which will occur by mid-2012, include chief executive Kevin Sharer's retirement on May 23. He will be succeeded by chief operating officer Robert Bradway. And the head of research and development , Roger Perlmutter, will retire on Feb. 12, to be replaced by chief medical officer Sean Harper.
The big shakeup isn’t a surprise to Wall Street, but it’s definitely a most welcome move. That’s because no matter how successfully the company has arduously navigated the intricate pathways of the complicated industry all these years to become one of the world’s largest biotech companies, Amgen has needed new leadership, according to analysts who know the enterprise well. Stiff competition in the drug industry and the constant need for new and better products have necessitated the changes at the top to secure fresh energy for new visionary leadership. Amgen is one of the handful of biotechs posting profits.
"We view the changes positively as we see Amgen as being in need of new leadership after several years of moderating results from legacy drugs, and earnings increasingly being supported by share buybacks," says Steven Silver, a drug analyst at Standard & Poor's. The changes didn't come as a surprise, because of the long tenure at Amgen of both Bradway and Harper, he adds. Bradway was added to the board earlier in 2011, which signaled his potential as the successor to Sharer.
The changes should in all likelihood renew attention to Amgen’s long-term drug pipeline and its cheap valuation even as the leadership changes have driven its stock higher. It has jumped just a whisker below its 52-week high of $63.85 a share, closing at $63.69 on Dec. 23, up from $58 on Dec. 16, when the changes were announced. But some analysts have a 12-month price target ranging from $69 to $79.
Amgen’s core product lineup can be described as mature products, but they include the world’s five best-selling biotech drugs, including Epogen, a genetically engineered hormone that stimulates the production of red blood cells in bone marrow, which generated total sales of $2.5 billion in 2010, and Neupogen, which stimulates production of white blood cells in cancer patients to prevent bacterial infection. Neupogen, along with another Amgen drug, Neulasta, also a white blood cell stimulant, produced sales of $4.84 billion last year.
The huge cash flow being generated by Amgen’s legacy drugs are sufficient to support dividends and share repurchases, says S&P analyst Silver, as well as the funding of R&D investments and acquisitions, such as the purchase in early 2011 of cancer vaccine maker BioVex. He adds that his buy recommendation on Amgen reflects his view that the recent rollout of Prolia, a drug for post-menopausal osteoporosis, and Xgeva, a treatment for skeletal-related issues in solid tumor cancer patients, will greatly enhance the stock’s value.
Prolia has other applications as well. In Europe, the drug was approved last year for the treatment of prostate cancer patients with bone loss due to hormone ablation. The company has applied with the FDA to approve the same use in the U.S. According to Silver, the FDA is expected to act on the application sometime in April 2012.
Amgen’s pipeline of new drug candidates is promising: Its AMG 386 for ovarian cancer and AMG 479 for pancreatic cancer are both in phase 3 clinical studies, as well as Oncovex, a drug for the treatment of melanoma and head-and-neck cancer. Amgen continues to collaborate or partner with big pharmaceutical companies to expand its reach. In December 2011, it signed a global agreement with Watson Pharmaceutical to develop and market oncology antibody drugs.
Michael J. Yee, analyst at RBC Capital Markets, concedes that Wall Street has low expectations from Amgen’s stock, but he says the bull case is that it "remains reasonably cheap," in part because the company is likely to forecast earnings for 2012 that are higher than consensus estimates. He also expects it to increase its dividend payments and continue share buybacks that he expects will amount to some $1 billion worth of stock in 2012. Amgen currently pays a dividend yield of 1.9%.
Rating the stock as outperform, he has a 12-month price target of $72 a share. Yee figures Amgen will earn $5.29 a share on revenues of $15.4 billion in 2011, and $5.94 in 2012 on sales of $15.9 billion. For 2013, Yee expects earnings of $6.40 a share on revenues of $16.4 billion.
True, Amgen isn’t among the top choices on Wall Street’s list of favored drug stocks, but that’s precisely one of the major reasons why the rewards will be much higher for this under-appreciated stock.
22 Hot Drugs Facing FDA Approval in 2012
Adam Feuerstein
11/29/11 - 08:55 AM EST
Updated with three additional drug approval decision dates.BOSTON (TheStreet) -- Here's your first look at the biotech and pharmaceutical companies with pending FDA drug approval decisions in 2012.
The calendar on the following pages captures nearly two-dozen U.S. regulatory events -- FDA drug approvals and advisory panels -- expected between December 2011 and July 2012. As every savvy biotech investor and trader knows, the volatility in biotech and drug stocks ramps significantly as U.S. regulators weigh whether to approve or reject new drugs.
 |
Among the highlights from the 2012 FDA drug-approval calendar that should be of most interest to bio-pharma investors: A first-quarter FDA advisory panel that will once again tackle the thorny issue of obesity-drug safety, including Vivus'(VVUS) Qnexa; approval decisions for novel inhaled medicines from Alexza Pharmaceuticals(ALXA) and MAP Pharmaceuticals(MAPP); and the fifth (!!) attempt at approval for Discovery Labs'(DSCO) lung therapy for premature infants.
Biotech and drug stocks below are listed in chronological order based on the closest regulatory catalyst.
Affymax(AFFY)
Drug/indication:peginesatide for anemia in kidney dialysis patients.
FDA advisory panel: Dec. 7, 2011
Approval decision date:March 27, 2012
Peginesatide, injected once monthly, aims to compete against Amgen's(AMGN) Epogen ($2.5 billion in 2010 sales) as a treatment for anemia in patients with chronic kidney disease, although peginesatide use would be limited to sicker kidney dialysis patients only. Amgen recently signed long-term Epogen supply contracts with the two largest kidney dialysis clinics in the U.S.
Pfizer(PFE)
Drug/indication:Inlyta (axitinib) for kidney cancer
FDA advisory panel: Dec. 7, 2011
Approval decision date: Feb-April 2012
Alexza Pharmaceuticals(ALXA)
Drug/indication:Adasuve for agitation related to schizophrenia
FDA advisory panel: Dec. 12, 2011
Approval decision date: Feb. 4, 2012
Adasuve uses Alexza's proprietary Staccato inhaler system to deliver the anti-agitation medicine loxapine directly into the lungs where it gets into the bloodstream and begins to work quickly. The FDA advisory panel is expected to focus much of its attention on the potential side effects and safety issues related to delivering Adasuve into patients' lungs.
FDA initially rejected Adasuve in October 2010 due to concerns over lung safety. Alexza resubmitted the drug to FDA last August.
Vivus(VVUS), Arena Pharmaceuticals(ARNA) and Orexigen Therapeutics(OREX)
Drugs/indication: Qnexa, lorcaserin and Contrave for obesity.
FDA advisory panel: First quarter 2012 (exact date not yet disclosed.)
FDA held advisory panels to review all three of these controversial weight-loss drugs in 2010. FDA subsequently rejected all three drugs. In 2012, Vivus and its obesity drug competitors are back for another shot, and FDA will once again bring together a group of outside experts to weigh the pros and cons of treating obesity with a pill.
Biogen Idec(BIIB) and Elan (ELN)
Drug/indication:Update to the Tysabri prescribing label
Approval decision date: Jan. 20, 2012
The Tysabri label update will include information about the anti-JC virus antibody status as a factor to help stratify the risk of progressive multifocal leukoencephalopathy (PML). Doctors can use to test to determine which multiple sclerosis patients are at low or high risk for PML, a serious, potentially fatal brain infection caused by Tysabri.
Columbia Labs(CBRX) and Watson Pharmaceuticals(WPI)
Drug/indication:progesterone vaginal gel for risk reduction of preterm birth.
FDA advisory panel: Jan. 20, 2012
Approval decision date:Feb. 26, 2012
Amylin Pharmaceuticals(AMLN)
Drug/indication: Bydureon for diabetes
Approval decision date: Jan. 27, 2012
This is the second shot at approval for Bydureon, a once-weekly injectable medicine for the treatment of Type 2 diabetes. Amylin recently split with its long-time marketing partner Eli Lilly(LLY). Alkermes(ALKS) retains its royalty split on Bydureon sales.
Bristol-Myers Squibb(BMY)
Drug/indication: dapagliflozin for diabetes
Approval decision date: Jan. 27, 2012
Pfizer(PFE) and Protalix Biotherapeutics(PLX)
Drug/indication: Uplyso for Gaucher's disease.
Approval decision date: Feb. 1, 2012
FDA has twice-rejected Uplyso due to manufacturing and quality control issues. If approved this time around, Uplyso will compete against Sanofi/Genzyme's(SNY) Cerezyme and Shire's Vpriv.
Teva(TEVA) and BioSante Pharmaceuticals(BPAX)
Drug/indication: Bio-T-Gel for hypogonadism
Approval decision date: Feb. 14, 2012
Bio-T-Gel is a once-daily gel used to treat low testosterone in men.
Corcept Pharmaceuticals(CORT)
Drug/indication: Corlux for Cushing's Syndrome.
Approval decision date: Feb. 17, 2012
FDA will not convene an advisory panel to review Corlux.
Discovery Labs(DSCO)
Drug/indication: Surfaxin for respiratory distress syndrome in premature infants.
Approval decision date: March 6, 2012
This is Discovery's fifth attempt at convincing FDA to approve Surfaxin.
Roche(RHHBY) and Curis(CRIS)
Drug/indication: Vismodegib for advanced basal cell carcinoma.
Approval decision date: March 8, 2012.
MAP Pharmaceuticals(MAPP)
Drug/indication: Levadex for migraines
Approval decision date: March 26, 2012
Levadex is an inhaled migraine drug. FDA has not yet announced whether it intends to hold an advisory panel to review Levadex.
Chelsea Therapeutics(CHTP)
Drug/indication: Northera for orthostatic hypotension
Approval decision date: March 28, 2012
Pfizer(PFE) and Bristol-Myers Squibb(BMY)
Drug/indication: Eliquis for prevention of stroke and blood clots in patients with atrial fibrilation.
Approval decision date: March 28, 2012
Onyx Pharmaceuticals(ONXX)
Drug/indication: Carfilzomib for multiple myeloma
Approval decision date: March 28, 2012 (estimated, not confirmed, based on Sept. 28, 2011 filing date.
FDA accepted the carfilzomib filing on Nov. 28 but has not yet set a specific approval decision date. I'm assuming a six-month priority review because carfilzomib is a cancer drug.
Vivus(VVUS)
Drug/indication: Qnexa for obesity
Approval decision date: April 17, 2012
FDA rejected Qnexa initially in 2010 due to safety concerns.
Vertex Pharmaceuticals(VRTX)
Drug/indication: Kalydeco for cystic fibrosis
Approval decision date: April 19, 2012
Kalydeco is the first drug to treat the underlying cause of cystic fibrosis in patients with a specific genetic defect.
Cell Therapeutics(CTIC)
Drug/indication: pixantrone for non-Hodgkin's lymphoma
Approval decision date: April 2012 (Specific date unknown.)
Cell Therapeutics appealed the FDA's 2009 decision to reject pixantrone, setting up the drug's second chance at U.S. approval.
Amgen(AMGN)
Drug/indication: Xgeva for prevention of bone metastases from prostate cancer.
Approval decision date: April 26, 2012
VVUS(VVUS)
Drug/indication: Avanafil for erectile dysfunction.
Approval decision date: April 29, 2012
Merck(MRK) and Ariad Pharmaceuticals(ARIA)
Drug/indication: ridaforolimus for sarcoma.
Approval decision date: June 5, 2012
Ironwood Pharmaceuticals(IRWD)
Drug/indication: linaclotide for irritable bowel syndrome.
Approval decision date: June 8, 2012
Amarin(AMRN)
Drug/indication: AMR101 for dyslipidemia.
Approval decision date: July 26, 2012
These Stocks are a Screaming “Buy” Right Now
Forget what you think you know about tech stocks. In fact, the term “tech stocks” has become pathetically ubiquitous.
 The definition is arbitrarily applied to thousands of “tech” companies, yet many of them have absolutely no meaningful innovation in the pipeline.
It’s unfair to lump them all together, anyway.
For example, can you really compare Pandora (NYSE: P) – an internet radio company without a dime in earnings – to Cisco (Nasdaq: CSCO), which sells $43 billion worth of network devices each year?
Or Zynga – the maker of Facebook-based games – with Google (Nasdaq: GOOG), which books $35 billion in ad revenue alone?
The answer is a resounding “no.”
It’s important to make a distinction, because one group of tech stocks – I call them “tech industrials” – is severely mispriced, poised for growth and sending us a clear “Buy” signal.
Let me explain…
Warren Buffett Just Upped the Ante
Take even a cursory look at tech sector headlines and you’ll see them littered with growth stories from the likes of Groupon (Nasdaq: GRPN) and LinkedIn (NYSE: LNKD).
The upcoming IPO for Facebook is already creating a major media buzz, too.
But the real value is hiding in the well-established, profitable technology behemoths – a.k.a. the tech industrials.
After all, when you consider which companies have provided the backbone for this digital age, you think about Google, Cisco, Microsoft (Nasdaq: MSFT), Apple (Nasdaq: AAPL) and Advanced Micro Devices (NYSE: AMD). And they have the massive profits and cash flows to prove it.
That’s why legendary investor, Warren Buffett, recently poured $10.7 billion into IBM (NYSE: IBM) and $200 million into Intel (Nasdaq: INTC). (You can check out our own side-by-side analysis of each company here.)
For a guy who usually favors investments in railroads, insurance and Coca-Cola (NYSE: KO), it’s interesting to see Buffett dipping into the tech sector for the first time.
But it makes perfect sense…
Big Tech’s Big Four: Sales, Earnings, Cash, Cheap
Fifteen years ago, Microsoft seemed like a fast-moving, yet hard-to-understand tech company. But today, we’re all familiar with how Microsoft’s operating systems work, how engrained they are in society, and the money they generate from businesses and consumers alike.
For example, the company’s cash flow is remarkably stable, dropping only four times in the last 25 years. Plus, when it has declined, it’s never fallen by more than 18%.
That same stability also underpins IBM, Intel, Cisco and the other tech industrials.
A closer look at the books reveals that tech industrials hold $194 billion in cash. Hardly surprising, given that their sales and earnings growth have surged by 40% and 92% respectively over the past five years. By contrast, the broader S&P 500 lags, with 17% and 13% growth, respectively.
What’s more, these tech companies are cheap. Those listed on the S&P trade at just 11.23 times earnings. And when you omit the huge cash hoards, the price-to-earnings ratio on tech industrials drops to 9.9.
As you can see, these businesses are a far cry from the unproven “tech newbies” that capture all the headlines, command soaring valuations and prompt questions of a new tech bubble.
And the tech industrials are set for a growth renaissance over the next decade. Here’s why…
We’re Slap-Bang in the Third – And Most Profitable – Tech Cycle
The technology business moves in cycles. According to legendary tech investor, Ben Horowitz, the first cycle was the mainframe computer. Next came home computing. And right now, we have the internet cycle.
These cycles each last about 25 years. And we’re midway through the internet cycle at the moment.
But here’s where it gets interesting for investors: Most of the wealth that’s created happens during the last 10 years of each cycle. And by a large margin, as the following graphics illustrate…
You’re probably wondering how the internet cycle can possibly have that far to grow, given that the number of internet users has exploded by 480% since 2000.
Well, while it might seem like the entire world is already electronic and online, internet users still only account for 30% of the global population.
As emerging markets – like those in Asia, South America and eventually Africa – get online, growth in this current cycle could dwarf the others.
The cycle goes something like this: More people and businesses will buy computers from companies like Dell (Nasdaq: DELL). The machines run on a Microsoft operating system. They’ll then use them to search Google, stream movies through Cisco network devices and use Apple’s devices to listen to music.
For these companies, helping more of the world get industrialized and online will prove to be an extremely lucrative process – just as it was for getting the current developed world into the technology age.
Bottom line: Don’t even think about pitching these tech industrials into the same category as other, much riskier “tech stocks.” Nor are they boring, stodgy value plays.
Instead, see them for what they are – critical, highly profitable businesses with an amazing growth opportunity over the next 10 years.
And at current valuations, you should also consider them a screaming “Buy.”
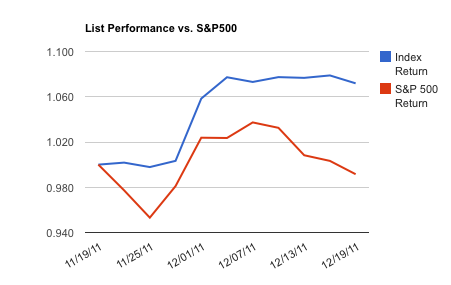
The definition is arbitrarily applied to thousands of “tech” companies, yet many of them have absolutely no meaningful innovation in the pipeline.It’s unfair to lump them all together, anyway.
For example, can you really compare Pandora (NYSE: P) – an internet radio company without a dime in earnings – to Cisco (Nasdaq: CSCO), which sells $43 billion worth of network devices each year?
Or Zynga – the maker of Facebook-based games – with Google (Nasdaq: GOOG), which books $35 billion in ad revenue alone?
The answer is a resounding “no.”
Let me explain…
Warren Buffett Just Upped the Ante
Take even a cursory look at tech sector headlines and you’ll see them littered with growth stories from the likes of Groupon (Nasdaq: GRPN) and LinkedIn (NYSE: LNKD).
The upcoming IPO for Facebook is already creating a major media buzz, too.
But the real value is hiding in the well-established, profitable technology behemoths – a.k.a. the tech industrials.
After all, when you consider which companies have provided the backbone for this digital age, you think about Google, Cisco, Microsoft (Nasdaq: MSFT), Apple (Nasdaq: AAPL) and Advanced Micro Devices (NYSE: AMD). And they have the massive profits and cash flows to prove it.
That’s why legendary investor, Warren Buffett, recently poured $10.7 billion into IBM (NYSE: IBM) and $200 million into Intel (Nasdaq: INTC). (You can check out our own side-by-side analysis of each company here.)
For a guy who usually favors investments in railroads, insurance and Coca-Cola (NYSE: KO), it’s interesting to see Buffett dipping into the tech sector for the first time.
But it makes perfect sense…
Big Tech’s Big Four: Sales, Earnings, Cash, Cheap
Fifteen years ago, Microsoft seemed like a fast-moving, yet hard-to-understand tech company. But today, we’re all familiar with how Microsoft’s operating systems work, how engrained they are in society, and the money they generate from businesses and consumers alike.
For example, the company’s cash flow is remarkably stable, dropping only four times in the last 25 years. Plus, when it has declined, it’s never fallen by more than 18%.
That same stability also underpins IBM, Intel, Cisco and the other tech industrials.
A closer look at the books reveals that tech industrials hold $194 billion in cash. Hardly surprising, given that their sales and earnings growth have surged by 40% and 92% respectively over the past five years. By contrast, the broader S&P 500 lags, with 17% and 13% growth, respectively.
What’s more, these tech companies are cheap. Those listed on the S&P trade at just 11.23 times earnings. And when you omit the huge cash hoards, the price-to-earnings ratio on tech industrials drops to 9.9.
As you can see, these businesses are a far cry from the unproven “tech newbies” that capture all the headlines, command soaring valuations and prompt questions of a new tech bubble.
And the tech industrials are set for a growth renaissance over the next decade. Here’s why…
We’re Slap-Bang in the Third – And Most Profitable – Tech Cycle
The technology business moves in cycles. According to legendary tech investor, Ben Horowitz, the first cycle was the mainframe computer. Next came home computing. And right now, we have the internet cycle.
These cycles each last about 25 years. And we’re midway through the internet cycle at the moment.
But here’s where it gets interesting for investors: Most of the wealth that’s created happens during the last 10 years of each cycle. And by a large margin, as the following graphics illustrate…
You’re probably wondering how the internet cycle can possibly have that far to grow, given that the number of internet users has exploded by 480% since 2000.
Well, while it might seem like the entire world is already electronic and online, internet users still only account for 30% of the global population.
As emerging markets – like those in Asia, South America and eventually Africa – get online, growth in this current cycle could dwarf the others.
The cycle goes something like this: More people and businesses will buy computers from companies like Dell (Nasdaq: DELL). The machines run on a Microsoft operating system. They’ll then use them to search Google, stream movies through Cisco network devices and use Apple’s devices to listen to music.
For these companies, helping more of the world get industrialized and online will prove to be an extremely lucrative process – just as it was for getting the current developed world into the technology age.
Bottom line: Don’t even think about pitching these tech industrials into the same category as other, much riskier “tech stocks.” Nor are they boring, stodgy value plays.
Instead, see them for what they are – critical, highly profitable businesses with an amazing growth opportunity over the next 10 years.
And at current valuations, you should also consider them a screaming “Buy.”
Looking for highly profitable companies but don’t know where to start? Here are some ideas to get you started.
We ran a screen on the tech sector for stocks rallying above their 20-day, 50-day, and 200-day moving averages, indicating very strong bullish sentiment and upward momentum.
We screened these stocks for those seeing consistent increases in diluted normalized EPS over the last four years. (We also made sure that all companies had positive earnings for all four years.)
Interactive Chart: Press Play to compare changes in analyst ratings over the last two years for the stocks mentioned below. Analyst ratings sourced from Zacks Investment Research.
We also created a price-weighted index of the stocks mentioned below, and monitored the performance of the list relative to the S&P 500 index over the last month. To access a complete analysis of this list's recent performance, click here.
Do you think these companies will continue to see increasing earnings? Use this list as a starting point for your own analysis.
List sorted by market cap.
1. Google Inc. (GOOG): The world's most popular search engine. Market cap of $201.40B. The stock is currently trading at 2.57% above its 20-Day SMA, 4.59% above its 50-Day SMA, and 11.81% above its 200-Day SMA. Diluted normalized EPS increased from 13.29 to 13.31 during the first time interval (12 months ending 2008-12-31 vs. 12 months ending 2007-12-31). For the second time interval, diluted normalized EPS increased from 15.8 to 20.41 (12 months ending 2009-12-31 vs. 12 months ending 2008-12-31). And for the last time interval, the EPS increased from 20.41 to 26.31 (12 months ending 2010-12-31 vs. 12 months ending 2009-12-31). The stock has gained 4.5% over the last year.
2. Rackspace Hosting, Inc. (RAX): Operates in the hosting and cloud computing industry. Market cap of $5.80B. The stock is currently trading at 4.33% above its 20-Day SMA, 7.48% above its 50-Day SMA, and 10.57% above its 200-Day SMA. Diluted normalized EPS increased from 0.17 to 0.19 during the first time interval (12 months ending 2008-12-31 vs. 12 months ending 2007-12-31). For the second time interval, diluted normalized EPS increased from 0.19 to 0.24 (12 months ending 2009-12-31 vs. 12 months ending 2008-12-31). And for the last time interval, the EPS increased from 0.24 to 0.35 (12 months ending 2010-12-31 vs. 12 months ending 2009-12-31). The stock is a short squeeze candidate, with a short float at 9% (equivalent to 5.97 days of average volume). The stock has gained 42.7% over the last year.
3. Jack Henry & Associates Inc. (JKHY): Provides integrated computer systems and services for in-house and outsourced data processing to commercial banks, credit unions, and other financial institutions primarily in the United States. Market cap of $2.85B. The stock is currently trading at 1.35% above its 20-Day SMA, 2.44% above its 50-Day SMA, and 7.66% above its 200-Day SMA. Diluted normalized EPS increased from 1.17 to 1.22 during the first time interval (12 months ending 2009-06-30 vs. 12 months ending 2008-06-30). For the second time interval, diluted normalized EPS increased from 1.22 to 1.38 (12 months ending 2010-06-30 vs. 12 months ending 2009-06-30). And for the last time interval, the EPS increased from 1.38 to 1.59 (12 months ending 2011-06-30 vs. 12 months ending 2010-06-30). The stock has gained 13.34% over the last year.
No comments:
Post a Comment