These five technical setups are showing solid upside potential right now. Here's how to trade them from here.

Stocks are testing new all-time highs once again this week. As I write, the big S&P 500 index sits a fraction of a percentage point below the new intraday high water mark that got set just last week.
But while the broad market inches its way higher in July, we're seeing more markedly bullish moves in lots of individual stocks. For example, while this month has brought a strong performance from the S&P, up 3.24%, the top fifth of S&P 500 components are actually up between 7% and 27% over that same timeframe. Focusing on the stocks that are working the best in this environment could be all it takes to supercharge your performance in the second half of the year.
To figure out which stocks look positioned to outperform here, we're turning to the charts for a technical look at five stocks that are teetering on the edge of breakout territory this week.
In case you're unfamiliar with technical analysis, here's the executive summary:Technical analysis is a way for investors to quantify qualitative factors, such as investor psychology, based on a stock's price action and trends. Once the domain of cloistered trading teams on Wall Street, technicals can help top traders make consistently profitable trades and can aid fundamental investors in better planning their stock execution.
Without further ado, here's a rundown of five technical setups that are showing solid upside potential right now.
Caterpillar
Up first on our list of breakout trades is $47 billion heavy equipment companyCaterpillar (CAT) . Caterpillar has been an outstanding performer so far in 2016. Since the calendar flipped to January, this big industrial has handed investors total returns of 21%, leaving the rest of the broad market in its dust.
But don't worry if you've missed that move in Cat. The good news is that shares look primed for a second leg higher from here.
Some extra evidence for the Caterpillar trade comes from this stock's relative strength line. Relative strength, which measures this stock's price performance versus the broad market, has been in an uptrend since the beginning of the year, confirming that this stock is still outperforming the S&P at this point. If you're waiting to buy, hold out for a more material push above $79 before you pull the trigger.
Coherent 
We've got the exact same setup forming in shares of $2.3 billion tech companyCoherent (COHR) . Like Caterpillar, Coherent is forming a textbook ascending triangle pattern after outperforming the rest of the market all year long. For this small tech trade, the key breakout level to watch is resistance up at $97.50.

What's so special about the $97.50 level? It all comes down to buyers and sellers. Price patterns, like this ascending triangle setup in Coherent, are a good quick way to identify what's going on in the price action, but they're not the actual reason that makes the stock tradable. Instead, the "why" comes down to basic supply and demand for COHR's shares themselves.
The $97.50 resistance level is a price where there has been an excess of supply of shares; in other words, it's a spot where sellers have been more eager to step in and take gains than buyers have been to buy. That's what makes a breakout above $97.50 so significant -- the move means that buyers are finally strong enough to absorb all of the excess supply above that price level. Once Coherent cracks the $97.50 level, shares become well positioned to make a play for prior lifetime highs just above $107. Keep a close eye on this one.
Royal Caribbean Cruises
2016 hasn't been a very good year for cruise operator Royal Caribbean Cruises (RCL) . Since the calendar flipped to January, Royal Caribbean has been deeply underperforming the rest of the market, down almost 30% year-to-date. That's the bad news. The good news is that shares could be ready to stage a reversal in the very long term.
 Royal Caribbean is currently forming a long-term double bottom pattern, a bullish price setup that looks just like it sounds. The double bottom is formed by a pair of swing lows that bottom out at approximately the same price level; the buy signal comes on a push through the high that separates the lows. For Royal Caribbean, that breakout level to watch is resistance up at $85, a level that shares are moving back towards after forming their second bottom in the final week of June.
Remember to be reactionary with the Royal Caribbean trade, just like any of the other trading setups on our list today. Technical analysis is a risk management tool, not a crystal ball, and RCL doesn't become a high-probability upside trade until buyers are able to muster the strength to bid this stock above $85. Once that happens, it makes sense to join them.
Tyco International
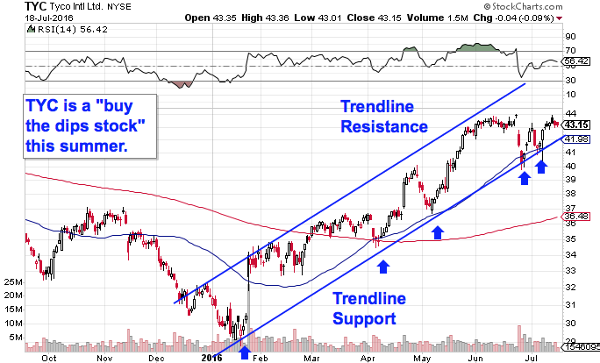
Meanwhile, it hasn't exactly taken an expert trader to figure out the price pattern behind the 35% rally in shares of $18 billion security stock Tyco International (TYC) in 2016. Instead, the price action in this stock is about as simple as it gets. Tyco has been a "buy-the-dips stock" all year long -- and this stock is showing investors another buyable dip in July.

Tyco has been in a well-defined uptrending channel all year long. The uptrend in this stock is formed by a pair of parallel support and resistance lines that have managed to corral about 99% of this stock's price action over that stretch. Put simply, every time this stock has touched the bottom of its price range, it's presented traders with a low-risk, high-reward buying opportunity. So, as Tyco International pushes off of support for the fifth time here, it makes sense to buy this bounce.
Waiting for that bounce is important for two key reasons: it's the spot where shares have the most room to move up before they hit resistance, and it's the spot where the risk is the least (because shares have the least room to move lower before the channel breaks, and you know you're wrong). Remember, all trend lines do eventually break, but by actually waiting for a bounce to happen first, you're ensuring Tyco can still catch a bid along that line before you put your money on shares.
Target

Last on our list of breakout trades is a blast from the past: big box retail giantTarget (TGT) .
When we last looked at Target at the end of June, this retailer was looking "bottomy" after a major selloff that kicked off in mid-April. The price setup in play was an inverse head and shoulders pattern, a bullish reversal pattern that triggered with a move through $70. At the time, the prognosis was pretty interesting: " Once shares are able to catch a bid above $70, the gap this stock made in May is likely to get filled quickly."
Sure enough, Target broke out above $70 a few sessions later and then managed to re-fill the price gap on the chart within a handful of trading sessions. The big question now is where it goes from here.
Not surprisingly, Target is consolidating a bit after its quick move higher. Shares are holding just below $74, the resistance level that marks the top of the gap from May -- that's no coincidence. Consolidations aren't uncommon after quick moves, and they typically resolve in the same direction they started. For Target, that suggests a second leg higher is likely from here.
If you bought the $70 breakout, don't sell yet. If you didn't buy at $70, consider taking on a position if and when Target cracks that nearby dashed line at $74. Either way, it's a good idea to keep a protective stop right on the other side of $72.50.
From a fundamental perspective, Target is a holding in Jim Cramer's Action Alerts PLUS charitable portfolio. The portfolio rates Target a Three, meaning it would sell shares on strength. Cramer and Research Director Jack Mohr wrote recently:
Jonas ElmerrajiWe remain disappointed with Target's ugly second-quarter results, which called into question its ability to deliver on strategic initiatives and hit the 2% comparable sales growth rate. The company appears to be sitting in a purgatory of sorts; its premium brands do not command enough pricing power while its value proposition is weaker than value-driven e-commerce -- i.e., Amazon (AMZN) -- and in-store -- think Costco (COST) -- competitors. Recall that our stance since the company's recent disappointing earnings announcement has been to watch trigger levels of $60 (as a buying opportunity) and $70 (as a selling opportunity).
Source: https://www.thestreet.com/story/13644231/1/buy-these-5-breakout-stocks-now-for-big-gains.html
No comments:
Post a Comment