Bankruptcy Model Predictions About Research In Motion
The latest news for Blackberry [Research In Motion (RIMM)] has not been all that
positive. The top management is going through transitions. Meanwhile, Apple's
(APPL) iPhone and Google's (GOOG) Android phones are having
fantastic years. Blackberry is a pure play in the phone business. Rather than
single product companies, Apple and Google make products in diverse electronics
and software areas. This makes the oligopoly comparison more difficult. Other
weaker players such as Nokia (NOK) and Sony Ericson (ERIC) seem to be smaller niche
players now. They once were powerhouses and innovators in the cell phone market.
Will Blackberry become as irrelevant as Nokia and Telefonaktiebolaget LM
Ericsson or just Ericsson? The marketplace has changed dramatically. In this
article, the Z-Score model for bankruptcy will be applied to see how bad things
are getting for Blackberry. Each ratio will be analyzed. Hopefully, using the
trends in this model's score will shed some light on the company's
future.
The Z-Score model is a very simple way to think of downside risk and bankruptcy risk. However, studying each of its ratios can lead to insights. It is a linear model broken down into five financial statement ratios. The five year trend in each of these variables will be depicted as well as a commentary of the changes in the ratios.
Sales / Total Assets
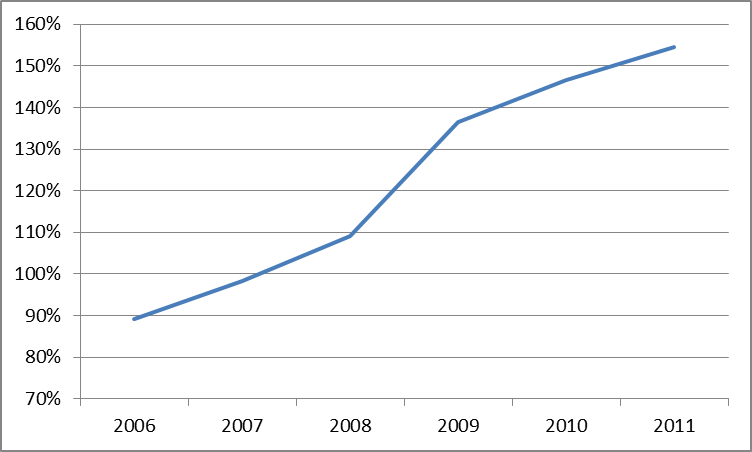
(Click to enlarge)
The first ratio of the Z-Score model is the Sales/Assets. An increase in this ratio is a positive sign. This ratio has dramatically increased in the past five years, meaning that the assets are more productive. It also means that sales have been growing at a healthy rate. The smart phone market has been growing rapidly and the iPhone market has also been growing enough to provide both manufacturers healthy growth rates.
Earnings before Interest and Taxes / Total Assets
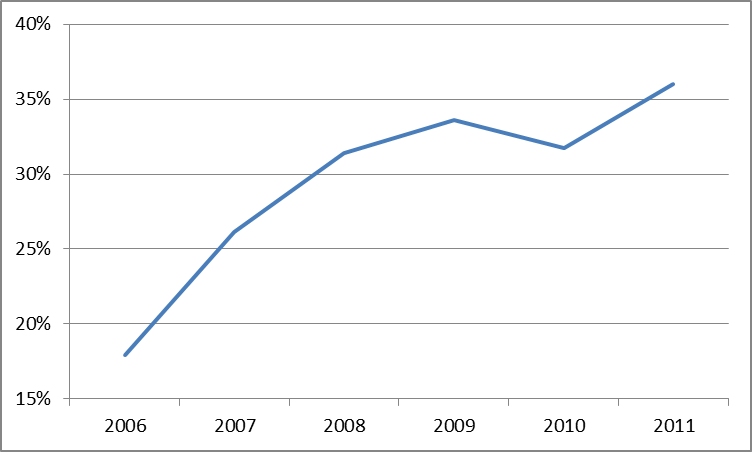
(Click to enlarge)
This ratio shows continued profitability. The profitability is strong and is increasing at an even faster rate than the asset base. However, when the profit margin and operating margins are examined for these years, they have a downward trend. Clearly, when considering just the income statement, while profitable, the company's margins are facing increased competition.
Working Capital / Total Assets
The amount of working capital as a percentage of assets is shrinking. This could be happening for two reasons. The amounts of accounts payable are increasing or the time it is taking to get paid by the customers is increasing. This is partially a factor since 5 years ago the accounts payable turnover was 15.3 versus 12.3 in the current year. Also the asset base of long lived assets could be decreasing as a percentage of total assets. The company is extending an enormous amount of credit to consumers in the form of accounts receivables. This went from 19% of assets to 33% of assets. This combined with a slowing in the payment time of accounts payable has led to a pronounced trend of deterioration over the last five years.
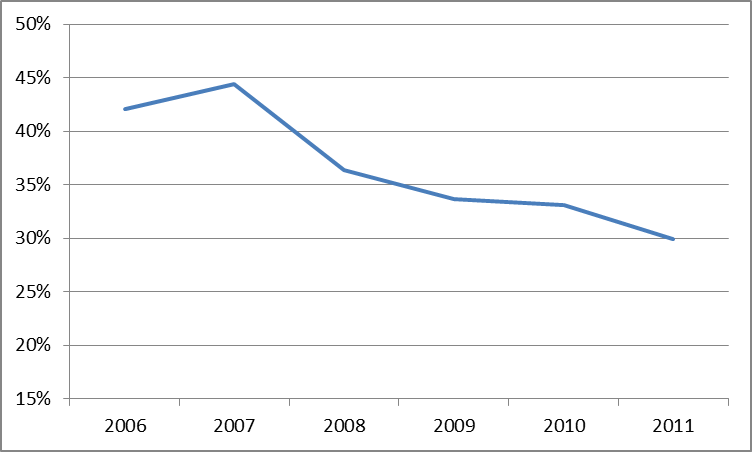
(Click to enlarge)
Retained Earnings / Total Assets
The trend in this ratio has been extremely clear. Over the last five years, RIMM has been able to build assets much faster than than it has incurred liabilities. It does not pay out a dividend on the net worth of the company as it continues to build. Yet this trend has leveled off in the most recent period.
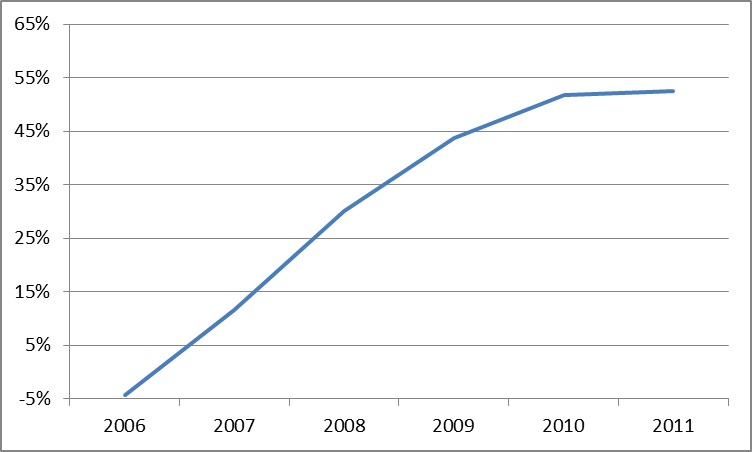
(Click to enlarge)
Market Value of Equity / Total Liabilities
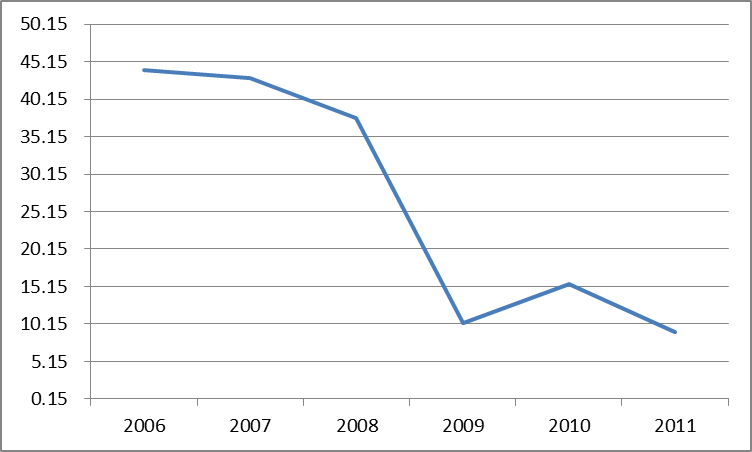
(Click to enlarge)
While net worth has been steadily and robustly increasing, the market value of equity has not. Shareholders' equity is doing well. However the market value of equity is a measurement of the market's expectation of the company's future. Obviously the market is signaling that Blackberry will encounter problems, even though from many of the ratios this is not the same picture. One explanation on the magnitude of the negative trend is the market's overreaction to Blackberry's initial performance. Four years ago the company had a market capitalization of $60 billion while currently it has a market capitalization of $35 billion. The company has been profitable during those years shown by the Sales to Asset Ratio and the EBIT to Assets ratio. However the changes in market value of equity come as the company has steadily increased liabilities.
Z-Score Bankruptcy Model
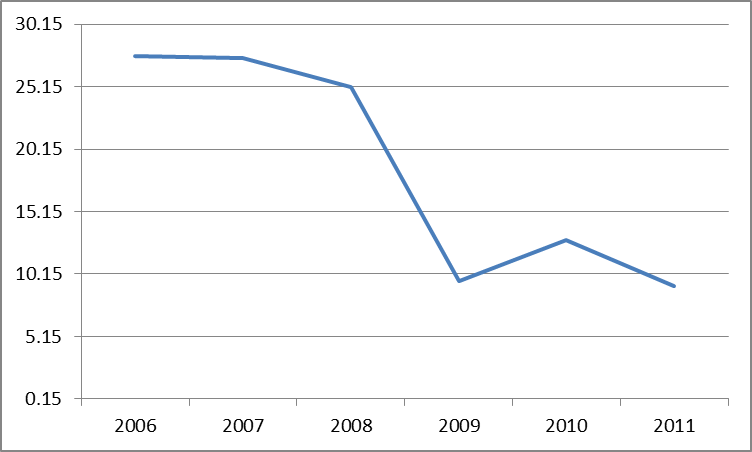
(Click to enlarge)
So the overall results of the bankruptcy model show that the picture has deteriorated dramatically. Not taking into account the equity market move in the company's stock improves the results. And the Z-Score levels are still well above levels that are considered a problem for companies. For example, companies with Z-Score of less than five are considered to be in severe financial difficulty. If things continue on this path bad things could be in store for Blackberry. Apple is a fierce competitor. They have nearly $100 billion of cash on their balance sheet. That amount of financing and momentum is going to be incredibly hard for RIMM to compete with. The same holds true for Google's Android phones.
Disclosure: I have no positions in any stocks mentioned, and no plans to initiate any positions within the next 72 hours.
The Z-Score model is a very simple way to think of downside risk and bankruptcy risk. However, studying each of its ratios can lead to insights. It is a linear model broken down into five financial statement ratios. The five year trend in each of these variables will be depicted as well as a commentary of the changes in the ratios.
Sales / Total Assets
(Click to enlarge)
The first ratio of the Z-Score model is the Sales/Assets. An increase in this ratio is a positive sign. This ratio has dramatically increased in the past five years, meaning that the assets are more productive. It also means that sales have been growing at a healthy rate. The smart phone market has been growing rapidly and the iPhone market has also been growing enough to provide both manufacturers healthy growth rates.
Earnings before Interest and Taxes / Total Assets
(Click to enlarge)
This ratio shows continued profitability. The profitability is strong and is increasing at an even faster rate than the asset base. However, when the profit margin and operating margins are examined for these years, they have a downward trend. Clearly, when considering just the income statement, while profitable, the company's margins are facing increased competition.
Working Capital / Total Assets
The amount of working capital as a percentage of assets is shrinking. This could be happening for two reasons. The amounts of accounts payable are increasing or the time it is taking to get paid by the customers is increasing. This is partially a factor since 5 years ago the accounts payable turnover was 15.3 versus 12.3 in the current year. Also the asset base of long lived assets could be decreasing as a percentage of total assets. The company is extending an enormous amount of credit to consumers in the form of accounts receivables. This went from 19% of assets to 33% of assets. This combined with a slowing in the payment time of accounts payable has led to a pronounced trend of deterioration over the last five years.
(Click to enlarge)
Retained Earnings / Total Assets
The trend in this ratio has been extremely clear. Over the last five years, RIMM has been able to build assets much faster than than it has incurred liabilities. It does not pay out a dividend on the net worth of the company as it continues to build. Yet this trend has leveled off in the most recent period.
(Click to enlarge)
Market Value of Equity / Total Liabilities
(Click to enlarge)
While net worth has been steadily and robustly increasing, the market value of equity has not. Shareholders' equity is doing well. However the market value of equity is a measurement of the market's expectation of the company's future. Obviously the market is signaling that Blackberry will encounter problems, even though from many of the ratios this is not the same picture. One explanation on the magnitude of the negative trend is the market's overreaction to Blackberry's initial performance. Four years ago the company had a market capitalization of $60 billion while currently it has a market capitalization of $35 billion. The company has been profitable during those years shown by the Sales to Asset Ratio and the EBIT to Assets ratio. However the changes in market value of equity come as the company has steadily increased liabilities.
Z-Score Bankruptcy Model
(Click to enlarge)
So the overall results of the bankruptcy model show that the picture has deteriorated dramatically. Not taking into account the equity market move in the company's stock improves the results. And the Z-Score levels are still well above levels that are considered a problem for companies. For example, companies with Z-Score of less than five are considered to be in severe financial difficulty. If things continue on this path bad things could be in store for Blackberry. Apple is a fierce competitor. They have nearly $100 billion of cash on their balance sheet. That amount of financing and momentum is going to be incredibly hard for RIMM to compete with. The same holds true for Google's Android phones.
Disclosure: I have no positions in any stocks mentioned, and no plans to initiate any positions within the next 72 hours.
No comments:
Post a Comment