Includes: CRF, DDM, DIA, DOG, DXD, EEH, EPS, EQL, FEX, FWDD, HUSV,
Summary
Economic news and solid corporate earnings have helped maintain the rally in stocks.
Many believe that current asset prices do not reflect the many world problems and/or incorporate tax cut stimulus.
Evidence shows that neither is true.
The economic cycle shows no sign of fading.
There are plenty of attractive stock ideas.
With a light economic calendar, there is plenty of air time for pundit pontification. The record-setting market still has many shaking their heads. Many, after noting the many world problems, are asking:
Where is the fear?
Last Week Recap
My last edition of WTWA (two weeks ago) asked whether earnings season could spark a big rally. That was a pretty good topic to consider over the last two weeks. (And it is still quite relevant).
The Story in One Chart
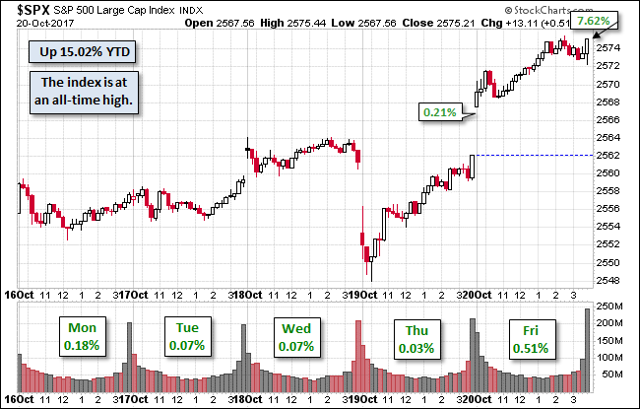
I always start my personal review of the week by looking at this great chart from Doug Short via Jill Mislinski. She notes the gain of 0.86% on the week, as well as other key comparisons. Once again, it was a week of very low volatility.
Doug has a special knack for pulling together all the relevant information. His charts save more than a thousand words! Read the entire post for several more charts providing long-term perspective, including the size and frequency of drawdowns.
Personal Note
Mrs. OldProf and I enjoyed our weekend away, and she thanks readers for the birthday good wishes. The only bad news for her was the loss of one of her favorite football players (second only to Jordy). When we got back, my calendar included a webinar featured by Brighttalk, which readers might enjoy.
If you missed my “Monty Hall” post, you might want to check it out. I cite some modern applications of the classic three-door problem.
The News
Each week I break down events into good and bad. For our purposes, “good” has two components. The news must be market friendly and better than expectations. I avoid using my personal preferences in evaluating news – and you should, too!
The economic news has been mostly positive.
The Good
- Industrial production rebounded from last month’s decline to a gain of 0.3%, beating expectations.
- Corporate earnings have been solid, with 76% of S&P 500 companies beating expectations. (Factset).
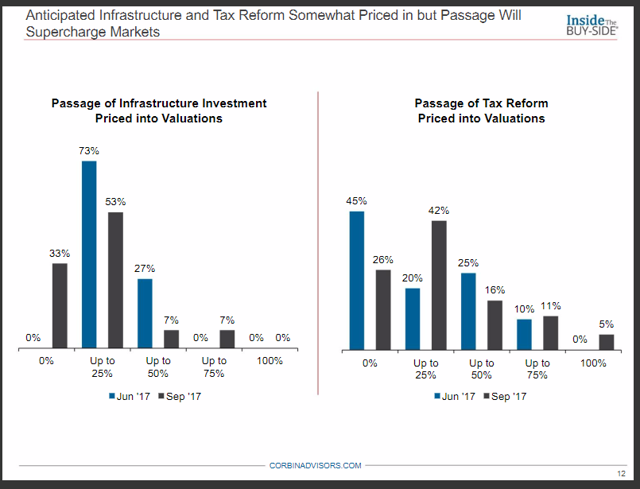
- Conference calls have been positive. Avondale has detailed notes. Corbin Perception also notes strength in industrial sentiment. More than half regard industrial equities as fairly valued, with “overvalued” declining. Tax reform or infrastructure spending are not priced into the market.
- Philly Fed index of 27.9 rose significantly from last month’s 23.8
- Existing home sales registered a slight beat of expectations with an annual rate of 5.39 million. Calculated Risk treats anything over 5 million as “solid.”
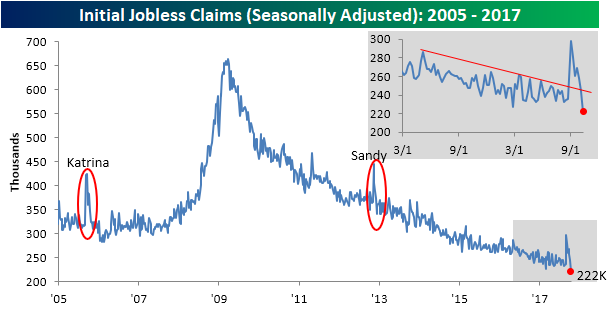
- Jobless claims declined to 222K. (Bespoke) New Deal Democrat’s hurricane adjustments for this series have proved accurate.
The Bad
- Housing starts declined to a seasonally adjusted annual rate of 1127K, a decline from August and a miss of the expected 1160K. (Calculated Risk).
- Leading indicators declined 0.2% after last month’s gain of 0.4%, missing expectations by 0.3%.
The Ugly
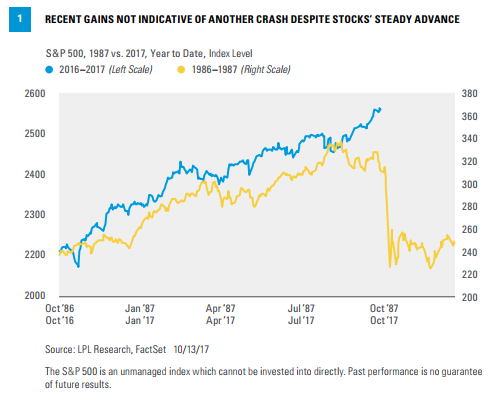
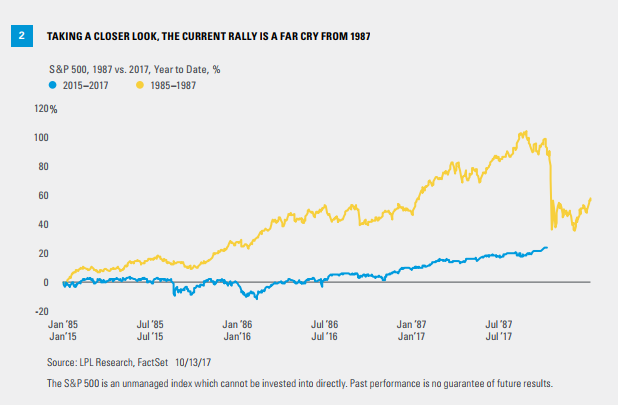
The 1987 market crash and allegations that 2017 is similar. LPL Research has a nice explanation of the differences, including the charts below. The first is a version of one popular among those who want to make sure you are scared witless. The second uses percentage changes for a valid comparison.
A Chuckle
Charlie Bilello makes creative changes in some classic market slogans. Here are the first few “Aphorisms in the Year of the Bull”:
Buy in May and Stay Leveraged Long
Buy the Rumor, Buy the News
Buy the Dip, Buy the Rip
Be Greedy When Others Are Greedy
The Week Ahead
We would all like to know the direction of the market in advance. Good luck with that! Second best is planning what to look for and how to react.
The Calendar
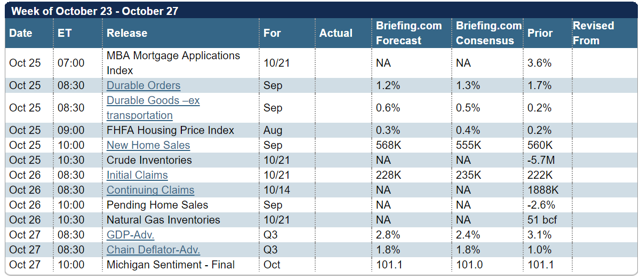
We have a fairly light week for economic data, featuring new home sales and the first report on Q3 GDP. Earnings season continues in full swing. And of course, we do not know what Twitter will bring us, but we can be confident that it will be something!
Briefing.com has a good U.S. economic calendar for the week (and many other good features which I monitor each day). Here are the main U.S. releases.
Next Week’s Theme
This week features a pretty light economic calendar. This always provides extra time for pundit pontification. Record-setting markets get daily attention, but it requires little time to take note of the new high. Attention quickly turns to questions about when the rally might end and what could be the spark. Most important of all might be investor attitudes.
Expect the punditry to be asking:
Where is the fear?
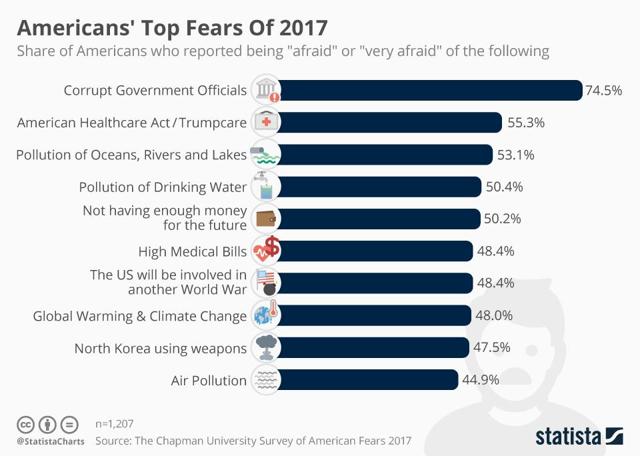
Statista cites the biggest current fears.
- Stocks are wildly overpriced – little future and crash potential. There is no fear among complacent investors.
- Stocks will decline, but….there might be a melt-up first. (I’m seeing this carefully hedged prediction more often).
- Nobel Prize winners do not understand current stock prices. (see Tim Duy below).
- Stock prices have increased in line with increased earnings (Brian Gilmartin) and economic confidence (which encourages a higher multiple). Bloomberg.
As usual, I’ll have more in the Final Thought, where I always emphasize my own conclusions.
Quant Corner
We follow some regular featured sources and the best other quant news from the week.
Risk Analysis
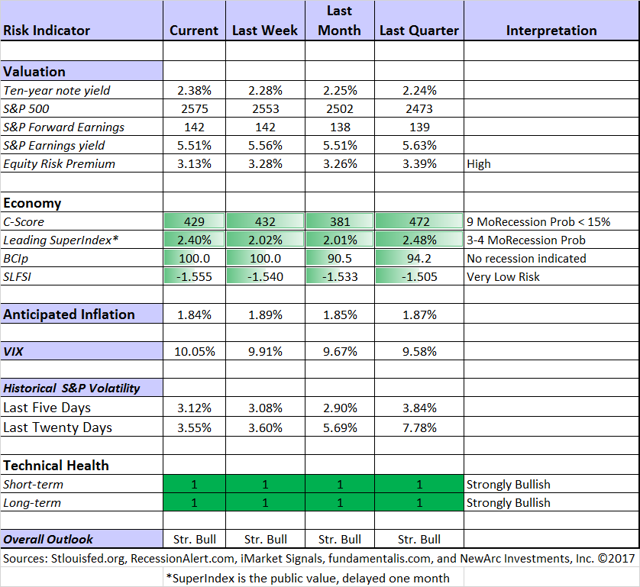
I have a rule for my investment clients. Think first about your risk. Only then should you consider possible rewards. I monitor many quantitative reports and highlight the best methods in this weekly update.
The Indicator Snapshot
The Featured Sources:
Bob Dieli: Business cycle analysis via the “C Score.
RecessionAlert: Strong quantitative indicators for both economic and market analysis.
Brian Gilmartin: All things earnings, for the overall market as well as many individual companies.
Georg Vrba: Business cycle indicator and market timing tools. It is a good time to show the chart with the business cycle indicator.
Doug Short: Regular updating of an array of indicators. Great charts and analysis.
Guest Sources:
Seeking Alpha Editor Mike Taylor highlights a strong academic report on recession forecasting. In a phrase, the yield curve does better than the stock market when looking at a lead time of more than two quarters. This is supportive of our methods, and shows why economic indicators do better than the market.
Insight for Traders
We have not quit our discussion of trading ideas. The weekly Stock Exchange column is bigger and better than ever. We combine links to trading articles, topical themes, and ideas from our trading models. This week’s post compared momentum and dip-buying methods, with several interesting trading ideas. Blue Harbinger has taken the lead role on this post, using information from me and from the models. He is doing a great job.
Insight for Investors
Investors should have a long-term horizon. They can often exploit trading volatility!
Best of the Week
If I had to pick a single most important source for investors to read this week it would be Tim Duy’s analysis of “newly minted” Nobel laureate Richard Thaler’s take on risk and the stock market. Prof. Thaler, while not “understanding it” believes that we are in the “riskiest moment of our lives” while the stock market is napping. Prof. Duy notes the many past historical risks, including, for example, the Cuban missile crisis. He also cites the record of another Nobel Prize winner and acclaimed expert on bubbles, Prof. Shiller.
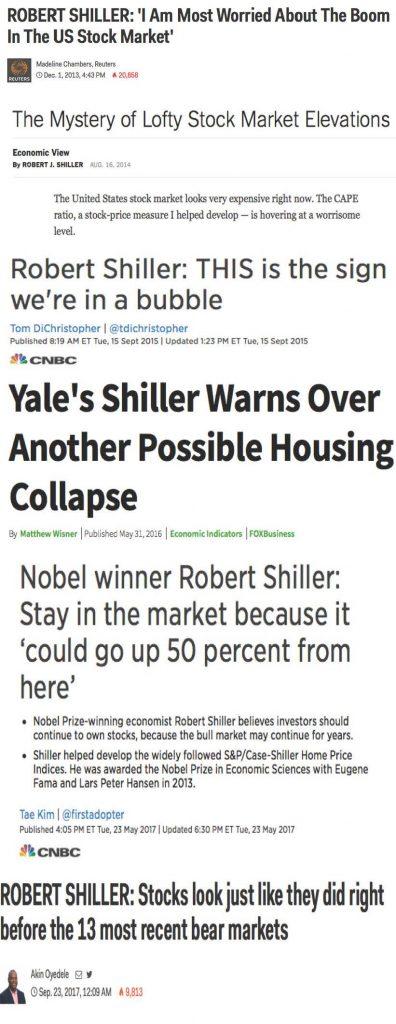
Ex-Prof. Miller agrees with Tim Duy. The well-deserved Nobel prizes do not imply expertise on everything, apparently including the Wall of Worry concept.
Stock Ideas
Stone Fox Capital explains how to analyze IBM. Hint: Drop the focus on the revenue decline.
Gold? A China play? The “mad hedge fund trader” explains.
Blue Harbinger provides some careful analysis in support of his recommendation of Triton International (TRTN). Take a look at his deep dive into the business model as well as the strong (4.7%) dividend.
Chuck Carnevale continues his discussion of Dow stocks with an analysis of several that he regards as “fairly valued.” Those in the “bubble” camp, should be taking a careful look at this series. It illustrates how a sophisticated analyst can discover value in a market at all-time highs.
Total return ideas for 2018 (from Merrill via 24/7).
Lessons from Trading
We frequently feature Dr. Brett Steenbarger when we talk trading. He is the leading expert on psychology, performance, and many other related topics. His conclusions for traders are often quite apt for investors as well. Consider this week’s post on trader mistakes. It describes many investors as well.
The one refrain I've heard from those active traders over the past two years is: this is going to turn around. Stocks are too expensive. Rates are too low. Volatility is too cheap. Everyone wants to catch the turn and profit from the break. So stocks dip, VIX bounces, put/call ratios go to the moon, and the trends continue. Moderate growth with modest inflation and low interest rates that make stocks a desirable carry instrument mean that SPY has ground higher and vol has ground lower.
Traders' forecasts for reversals in stocks and vol have had more of a psychological grounding than a logical one. Hope is not a business plan and it's not an edge in markets.
Traders' forecasts for reversals in stocks and vol have had more of a psychological grounding than a logical one. Hope is not a business plan and it's not an edge in markets.
Dividend stocks
David Fish has a nice update on the dividend increases from the “champion” group. He also has related updates for challengers and contenders. For those seeking a consistent stream of dividend income, this is a great source to follow.
The Next Big Thing
How is value created over time? “Davidson” via Todd Sullivan provides both theory and some examples.
But, how does one forecast inventions such as the iPhone, the Internet, a cure for Hepatitis C or preventative for HIV which force forecasters to revise all their previous assumptions of earlier forecasts. How does one forecast the future of markets if one never anticipated such evolutionary discoveries? The answer lays in not trying to predict the details of the ‘next great discovery’ but resides in understanding how individuals and society thinks and behaves.
One begins by identifying how value is created over time. Once one delves into the process of value creation, it forces one to conclude that value occurs when producers successfully meet the needs of society’s relentless desire to improve its standard of living.
Big winners from autonomous driving, and what is blocking the way. (24/7)
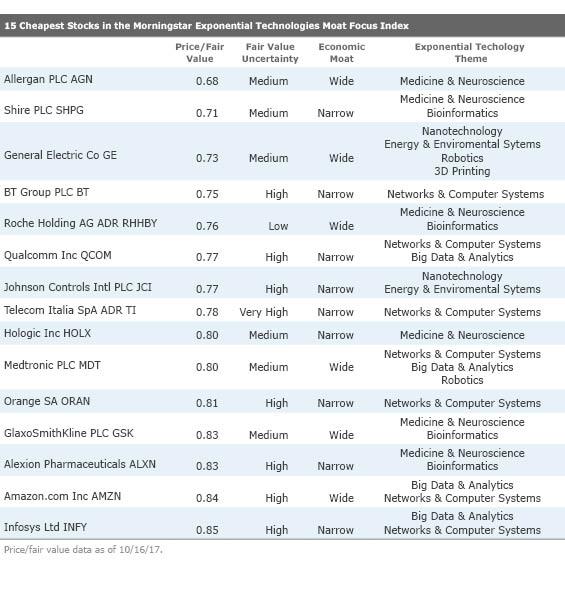
Morningstar takes a look at stocks in their Exponential Technologies Index. They cite important themes, rapidly growing technologies, and motes. That said, the resulting names are speculative.
Identifying the "next big thing" before it takes off takes a lot of skill, a little luck, and a leap of faith. After all, if you wait until a new product or technology is flying off the shelves, investors' optimistic expectations of future growth are likely already reflected in the stock's price.
Here are some current ideas, which include choices that will surprise many.
Personal Finance
Seeking Alpha Senior Editor Gil Weinreich has an interesting topic every day. His own commentary adds insight and ties together key current articles. As usual this week he had several good articles, but my favorite is his post about whether people should work longer before retirement. Gil emphasizes the help this provides for retirement expenses, and that is important to consider. I would add that enjoying your work is crucial. Some would like to continue, but with fewer hours. Others might find things they always wanted to do, and which provide a little extra income. This is really a great topic.
Tadas took a well-deserved vacation. As usual, Abnormal Returns featured some interesting questions with answers from financial bloggers. They are all well worth reading. This is information that is useful, but difficult to get in any other way. I always enjoy reading the answers from colleagues and reconsidering my own. I am a little disappointed in the answers to “changing minds.” Many of the participants have been wrong about both methods and results. Maybe they should be doing some re-examination. Consider the answers to the Buffett bet question. If you do not think you can improve on an index fund, you must take a hard look at the value of your service. Mr. Buffett himself says that if markets were efficient, he would be on a street corner selling pencils from a tin cup. He would take his own bet! Eddy Elfenbein highlights some key answers.
Watch out for….
Nvidia (NVDA). Great company. Brilliant execution of strategy. A great company does not always make a great stock. Price is important. (Dividend Sensei).
Final Thoughts
There are several errors in the mainstream analysis of fear.
- Just because the market has low volatility does not mean that investors are complacent. The market does not consist of a single, uninterested investor or trader. It is the result of millions of decisions, reflecting a range of viewpoints and objectives.
- Asset prices of stocks are reasonable if you look at the premium of expected returns over inflation.
- There are many frightened investors on the sidelines.
- So many assume that a long business cycle must mean we are near the end. Wrong! No one knows how much longer it might last.
There is a lot of lightweight analysis and it is all very popular. It caters to popular conceptions of economics, markets, and experts. The challenge for investors is to look at evidence in an open-minded fashion.
What worries me…
- The number of ETFs and the lack of liquidity in many.
- Excessive speed. Faster communications and a shortened news cycle seem fine in principle, but too many decisions of all types are made impulsively.
…and what doesn’t
- The Fed. We are still more than a year away from when changes in Fed policy will be important for stocks, despite the popular focus on this topic. It also does not matter (in the short run) whom President Trump selects to be the new Fed Chair, or his other appointments.
- Low VIX readings. The so-called “fear gauge” is low because actual trading volatility is low.
Disclosure: I am/we are long IBM, GE.
By Jeff Miller
Source:https://goo.gl/r6V4tE
No comments:
Post a Comment