Summary
Target got hammered when investors saw their terrible earnings release.
The enormous fall creates a great opportunity as the dividend champion is one on an exceptional sale.
EV/EBITDA is one of the great tools for evaluating a company that will expense a large amount of depreciation when physical real estate is appreciating.
Using EV to EBITDA, it appears Target is trading at multiples last seen in the Great Recession.
Subscribers received early access to an extended version of this article.
Shares of Target (TGT) got demolished when the market opened on 2/28/2017. Management had guided for weak earnings performance and sent the share price lower, but the market still wasn’t prepared for this level of ugly. That begs the question, how much should Target have fallen? In my view, the poor earnings release justified a 3% decline, perhaps a 5% decline at the top end.
A 13% decline is simply putting shares on sale. The company is extremely attractive on most fundamental valuation measures and I dramatically raised my stake. Personally, I purchased enough shares of TGT between $57.90 and $58 to increase my share count by 90% of the original value. Let’s go over the fundamentals case for Target.
Investors wanting to know exactly what I own can look inside my portfolio.
EV to EBITDA
I pulled some charts from Yahoo Finance to demonstrate the history of EV to EBITDA ratios for TGT:
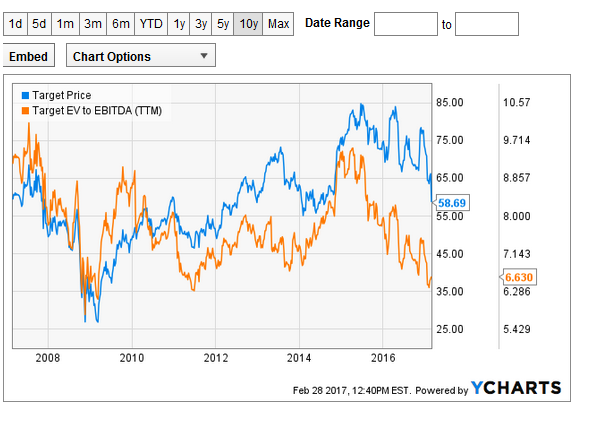
Over the last 10 years, the only time it spiked materially under 6.3x was during the middle of that “Great Recession” thing. That turned out to be a good time to buy just about anything.
However, Yahoo Finance doesn’t update immediately. That can be demonstrated by viewing a 5-day chart:
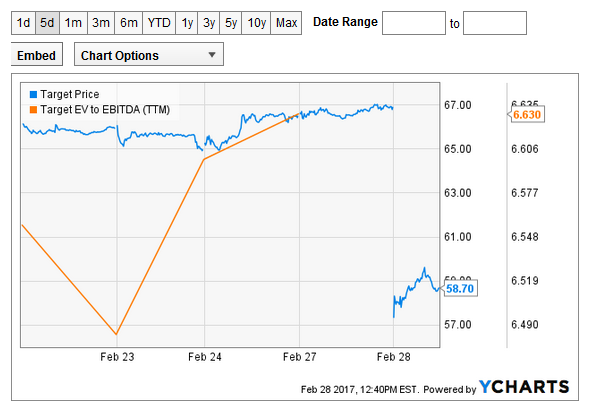
Notice how EV to EBITDA is not available after 02/24/2017. Instead, the value for 02/24/2017 is represented on the other chart as the current value, at 6.630.
Overly Simplified Calculations
One of the difficulties in running EV to EBITDA is stating precisely what calculations go into EV. There is plenty of room for even educated analysts to disagree. The simplified formula is:
Market Cap + Debt – Cash = EV
That seems simple enough, but should we just use long-term debt that still has a long time until maturity? That wouldn’t make sense. We would not want to ignore the current portion of the debt. So we need to pull total debt. On the other hand, we could make legitimate arguments for whether inventory should be counted as “near cash” if the turnover rate is extremely high. Clearly, there is also room to argue over accounts payable and accounts receivable.
The consolidated statements in the earnings release didn’t give a breakdown for accounts receivable, but accounts payable is less than inventory and I expect a high turnover ratio.
Turnover Ratio
To assess the inventory turnover, we just compare the inventory value to the cost of goods sold for the prior year:
They are turning over inventory a little less than 6 times per year, so they should sell more than the entire inventory value within the next quarter. That looks like their inventory management is good enough to me.
Calculating EV to EBITDA
Since inventory exceeds accounts payable and accounts receivable is not listed, I’ll just ignore those values.
If I were to use them as an adjustment to cash, it would increase cash, which would decrease net debt. That would make the “enterprise value” lower. Feels a little complicated? Here is a simple chart to break it down:
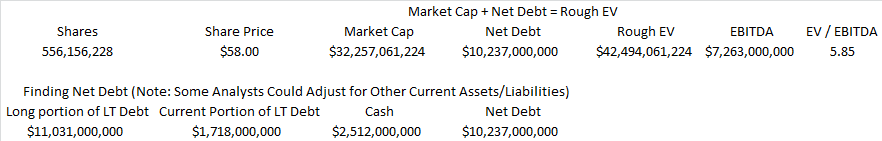
The bottom section finds the net debt, and we add that to the Market Cap to find enterprise value. If we had more cash from adding in inventory and subtracting accounts payable, it would mean less net debt. Consequently, we would have a slightly lower enterprise value and the EV/EBITDA ratio would be even lower.
By my calculations, this is running around 5.85. Compare that to the chart and it looks like TGT is trading at similar multiples to where it was in the great recession. Does that make you feel at least a little bullish? It was enough for me to significantly increase my stake
Disclosure: I am/we are long TGT.
I wrote this article myself, and it expresses my own opinions. I am not receiving compensation for it. I have no business relationship with any company whose stock is mentioned in this article.
Additional disclosure: Data from public sources (IE Yahoo Finance) assumed accurate. No investment advice. Do your own due diligence.
No comments:
Post a Comment