Summary
Last week's stock market decline was not about the Fed.
Declining prices for oil and other commodities remain the short-term influence on stocks.
Economic news was mixed. Will the Fed ignore the message from commodities?
Investors should note that commodity prices have been a poor method for long-term forecasting.
Traders must accept the reality of the current market focus.
Attention quickly shifted from the perceived strength in the monthly employment report to the stock market decline. While some blamed this on the expectation of higher interest rates, there was also plenty of focus on the commodity markets. I expect this interest to continue in the week ahead. The punditry will be asking:
What is the message from falling commodity prices?
Prior Theme Recap
In my last WTWA I predicted that the market story would focus on the effects of higher interest rates - widely expected after the strong employment report. This guess looked good at the start of the week, but gradually the premise eroded. By week's end the payroll data looked more like a one-off, so the interest rate effects reversed. To get the full story, let us look at Doug Short'sweekly chart. Doug's full post shows the various relevant moving averages in a very negative week for stocks. (With the ever-increasing effects from foreign markets, you should also add Doug's World Markets Weekend Update to your reading list).
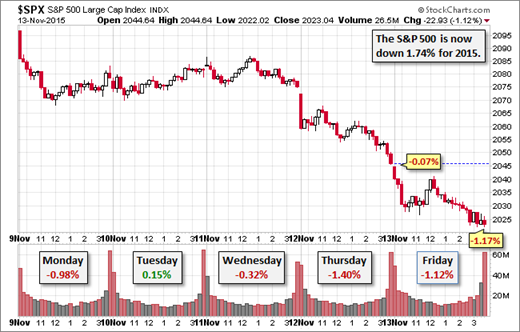
Doug's update also provides multi-year context. See his full post for more excellent charts and analysis.
We would all like to know the direction of the market in advance. Good luck with that! Second best is planning what to look for and how to react. That is the purpose of considering possible themes for the week ahead. You can make your own predictions in the comments.
This Week's Theme
The economic calendar is again modest and earnings season is winding down. Just as quickly as the consensus built for a Fed rate hike, the market mood shifted again. The combination of dollar strength and falling oil prices reawakened fears of deflation and global economic weakness.
I expect this topic to seize attention, with people asking:
What is the message from falling commodity prices?
And also - Will the Fed be watching?
There are two basic viewpoints on the commodity question.
- Some prefer commodities as an economic indicator. The prices are not revised, not surveys, and not created by the government. Short-term trading has been linked to oil prices for months. The parade of pundits cites lower oil prices as a sign of global economic weakness. Some recession models (like the ECRI's) prominently include commodity prices.
- Some emphasize traditional economic data, often using a variety of indicators.
There is an argument for each approach, somewhat dependent upon one's time frame. Often the proponents of each viewpoint do not acknowledge any legitimacy for the other. Expect to see both arguments well represented in the week ahead.
As always, I have my own ideas, reported in today's conclusion. But first, let us do our regular update of the last week's news and data. Readers, especially those new to this series, will benefit from reading the background information.
Last Week's Data
Each week I break down events into good and bad. Often there is "ugly" and on rare occasion something really good. My working definition of "good" has two components:
- The news is market-friendly. Our personal policy preferences are not relevant for this test. And especially - no politics.
- It is better than expectations.
The Good
There was a little good news.
- More dovish commentary from ECB head Draghi. (FT)
- Inventories beat expectations. This means an upward adjustment in the soft Q3 GDP number.
- Las Vegas visitor traffic is hitting a new record, sparked by the return of convention business. (Calculated Risk)
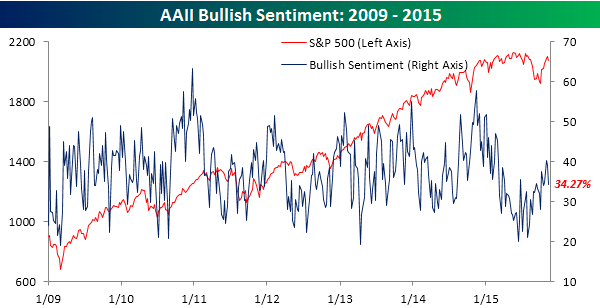
- Bullish sentiment declined. Bespoke notes how rapid the change has been, illustrating with their great charts. Here is one.
- Retail sales ex-auto beat expectations 0.4% versus 0.2%. If one accounts for lower gasoline prices, the story is even better. Consumption is higher but the reported sales are lower. (Diane Swonk)
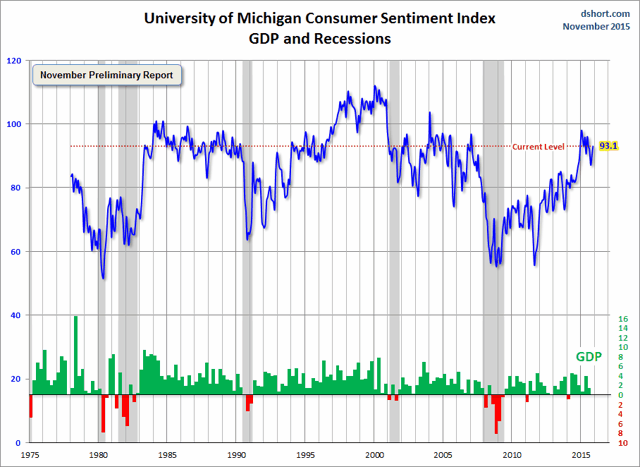
- Michigan sentiment was strong. Doug Short's chart shows how the reported 93.1 ranks historically. His full post provides additional charts and details.
The Bad
Some of the economic data missed expectations. Feel free to add other suggestions in the comments.
- Retail sales disappointed. This was partly the result of the prior month surge in auto sales, maintained but not showing more growth. (See core sales above). The results were underscored by earnings reports from some well-known retailers, including Macy's, Nordstrom, and Fossil. Each of these stocks took a double-digit hit.
- Initial jobless claims moved higher. The level of 276K is still low by historic standards, but the widely followed four-week moving average is now edging higher.
The Ugly
Paris terrorism. The FT has good coverage, including this lead story.
The Silver Bullet
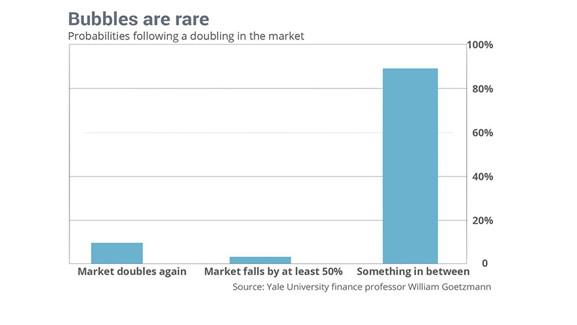
I occasionally give the Silver Bullet award to someone who takes up an unpopular or thankless cause, doing the real work to demonstrate the facts. Think of The Lone Ranger. This week's award goes to Yale Finance Professor William Goetzmann for his NBER study, Bubble Investing: Learning from History. Mark Hulbert highlights the overuse of "bubble" and cites data suggesting that the actual odds are only about 4%.
Quant Corner
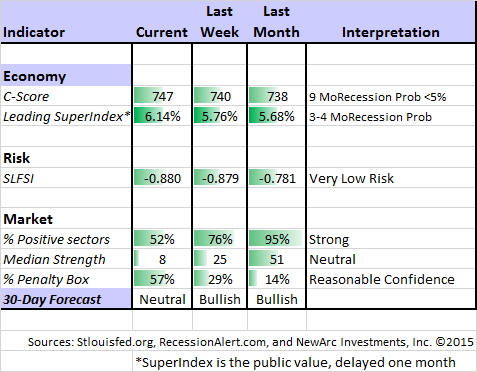
Whether a trader or an investor, you need to understand risk. I monitor many quantitative reports and highlight the best methods in this weekly update. For more information on each source, check here.
Recent Expert Commentary on Recession Odds and Market Trends
Bob Dieli does a monthly update (subscription required) after the employment report and also a monthly overview analysis. He follows many concurrent indicators to supplement our featured "C Score."
Georg Vrba: An array of interesting systems. Check out his site for the full story. We especially like his unemployment rate recession indicator, confirming that there is no recession signal. He gets a similar result from the Business Cycle Indicator, updated this week.
Doug Short: Provides an array of important economic updates including the best charts around. One of these is monitoring the ECRI's business cycle analysis, as his associate Jill Mislinski does in this week's update. The ECRI story is becoming repetitive and even more unhelpful. It seems too related to commodity prices, and only slightly changed from their failed recession forecast. It would be refreshing to see them do a complete reset and adopt a fresh approach.
RecessionAlert: A variety of strong quantitative indicators for both economic and market analysis. While we feature the recession analysis, Dwaine also has a number of interesting systems. These include approaches helpful in both economic and market timing. He has been very accurate in helping people to stay on the right side of the market.
New Deal Democrat updates five key economic metrics on a year-to-date basis. His chart pack and analysis shows improvement in four of the five, leading to the following summary:
In summary, 10 months into the year we finally have improvement in 4 of the 5 metrics, some more than others:
Involuntary part time employment has declined substantially.
Low oil prices have continued to benefit consumers.
Wage growth, driven in part by the decline in the broad unemployment rate, has finally started to improve.
Although the decline has stalled in the last several months, over the year there has been a decrease in the number of people not even in the labor force, but who want a job now.
Refinancing is still at low ebb. For the economic expansion to continue for a substantial time, we must either see a new low in rates (very unlikely), or real wages must continue to grow (at the moment looking likely).
The Week Ahead
It is a moderate week for economic data. While I highlight the most important items, you can get an excellent comprehensive listing at Investing.com. You can filter for country, type of report, and other factors.
The "A List" includes the following:
- Housing starts and building permits (NYSE:W). Economic strength would be helped by continuing solid growth in this sector.
- FOMC minutes . Observers will try to squeeze fresh information out of old news.
- Leading indicators (Th). A favorite of many -- expected to show strength.
- Industrial production (NYSE:T). Rebound from recent weakness?
- Initial claims (Th). Fastest and most accurate update on job losses.
The "B List" includes the following:
- CPI . Will not have much significance until there are a few hot months.
- Philly Fed (Th). Getting more attention recently. Regional reports have been weak, so expectations are low.
- Crude oil inventories . Focus on oil prices keeps this report in the spotlight.
FedSpeak includes at least three appearances, spread throughout the week.
How to Use the Weekly Data Updates
In the WTWA series I try to share what I am thinking as I prepare for the coming week. I write each post as if I were speaking directly to one of my clients. Each client is different, so I have five different programs ranging from very conservative bond ladders to very aggressive trading programs. It is not a "one size fits all" approach.
To get the maximum benefit from my updates you need to have a self-assessment of your objectives. Are you most interested in preserving wealth? Or like most of us, do you still need to create wealth? How much risk is right for your temperament and circumstances?
My weekly insights often suggest a different course of action depending upon your objectives and time frames. They also accurately describe what I am doing in the programs I manage.
Insight for Traders
Felix has shifted to neutral, leaning bullish. The penalty box indicator remains relatively low, suggesting a reasonable level of confidence. For more information, I have posted a further description -- Meet Felix and Oscar. You can sign up for Felix's weekly ratings updates via email to etf at newarc dot com. Felix appears almost every day at Scutify (follow him here).
Dr. Brett Steenbarger takes up the often-overlooked topic of drawdowns. Every trader hits what seems like a slump. What is the best practice? He suggests three simple rules. This is great advice from a great source!
Insight for Investors
I review the themes here each week and refresh when needed. For investors, as we would expect, the key ideas may stay on the list longer than the updates for traders. Major market declines occur after business cycle peaks, sparked by severely declining earnings. Our methods are focused on limiting this risk. Start with our Tips for Individual Investors and follow the links.
We also have a page summarizing many of the current investor fears. If you read something scary, this is a good place to do some fact checking.
Other Advice
Here is our collection of great investor advice for this week.
If I had to pick a single most important article, it would be this analysis from "Davidson" via Todd Sullivan. You may not be persuaded by every aspect of the argument, but the section on "Current Investor Misperceptions" is important.The current belief that we are in deflation or in a poor economy comes from two major misperceptions. The first misperception derives from the investor belief that commodity price movements lead to changes in inflation. Recent fall in commodity prices are believed to signal a weak global economy and deflation. Everywhere in the media is this repeated endlessly. Recent economic trends show that global economic expansion has been with us since 2009 and remains with us today. Commodity prices are like any prices; all prices are direct reflections of market psychology and future expectations by investors.
And…
The second misperception is that US GDP is slow and that stocks are over-priced by a substantial amount. This perception is where the calls for the Dow Jones Index to collapse from its current near $18,000 to $5,000 originate. This erroneous perception is over-turned by separating out the Private Economy from US GDP. The Private Economy is actually growing nicely, a little slower than in the past, but still decent.
Stock Ideas
Chuck Carnevale's most recent article covers the key elements of investing in growth stocks. He explains why these deserve a place in most retirement portfolios. Chuck also lays out some clear rules for identifying the best choices, carefully explaining the best approach to valuation. This is one of his typical combinations of valuable instruction with stock ideas and illustrations.
Berkshire Hathaway? 45% upside in the next year, says Whitney Tilson. He expects Mr. Buffett to lead for many more years, but says the stock has a 25% valuation cushion. See the full presentation via BI.
Watch out for….
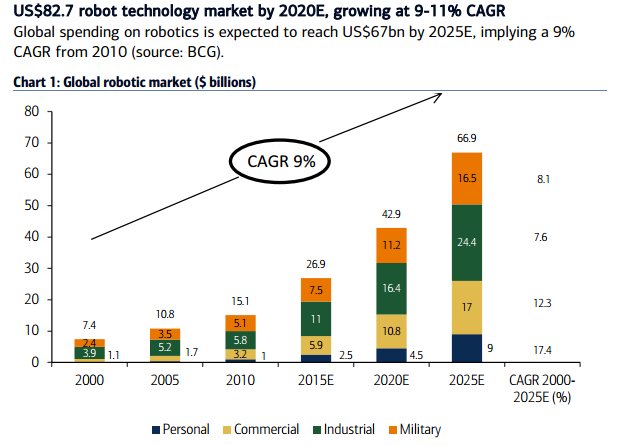
The robots! A Bank of England economist sounds the alarm on the "robot revolution." This could cost 80 million jobs in the U.S. (CNBC) and put workers "out to pasture" according to one billionaire investor. (CNBC). By contrast, you can take a look at the (high-paying) jobs created. Also check out Luddite.Rupert Hargreaves notes the scary predictions, but also lists eight "entry points" to play the robot revolution. He has a nice list of specific companies that are linked to the growth shown below.
And before getting too carried away on robot power, how about the traffic stop on the Google driverless car - another slow-moving vehicle holding up traffic!
Personal Finance
Professional investors and traders have been making Abnormal Returns a daily stop for ten year. The average investor should make time (even if not able to read every day as I do) for a weekly trip on Wednesday. Tadas always has first-rate links for investors in this special edition. There are several great links, but I especially liked this warning about penny stocks from Felix Salmon.
Here are some better things to do with your money than buy penny stocks:
Take all the tissues out of your tissue box and replace them with dollar bills.
Shred it and use it as confetti on New Year's Eve.
Make origami.
Give it to the least responsible person you know and ask him or her to earn you money.
Young Investors
When originally published, I missed this timeless advice from Morgan Housel. It has many great suggestions, but my favorite is #7:
The best thing money buys is control over your time. It gives you options and frees you from relying on someone else's priorities. One day you'll realize this freedom is one of the things that makes you truly happy.
Market Outlook and Timing
Ben Carson has a good reminder about keeping your personal time frame in mind. For most this is more successful than trying to guess the right times for big changes in asset allocation. Also check out his scatterplot of annual returns. You will see why "average" is misleading!
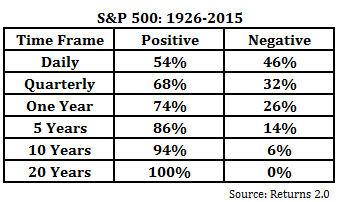
Josh Brown makes a similar point while emphasizing forecasts based upon market valuation. He cites data showing that methods like P/E ratio might be relevant for ten-year periods, but the relationship breaks down when looking at shorter time periods.
Final Thoughts
Understanding the factors behind market moves is a foundation for confidence in your own decisions. That is an important reason for my WTWA series.
Most of the "explanations" from financial media are really just noise - trying to explain small market fluctuations. Anything under a one percent move is simply normal volatility. Last week's selling deserves a bit more attention. So what happened?
- Despite the incessant efforts to use Fed policy to explain everything, this was not a reaction to the prospect of a modest move in short-term interest rates. Markets do not have "delayed reactions" to this type of news, so we would have seen more weakness last Friday if Fed concern was the culprit.
- Oil prices have shown a correlation with stock moves for months, so they are a part of trading algorithms. This repetitive behavior is also noted by traders, as Art Cashin reminds us almost every day.
- The argument about whether higher energy prices are good for the U.S. economy becomes irrelevant - at least in the short term - under these circumstances.
Trading and Investment Conclusions
In fact, commodity prices have not been a trustworthy economic indicator. The prices reflect both supply and demand, of course. The actions of producers are the important driver of prices. In fact, demand for oil and other energy sources has grown more in 2015 than in 2014. The strong dollar also creates the appearance of weakness in commodities, as this chart (McClellan Financial Publications) of copper priced in both yen and dollars illustrates:
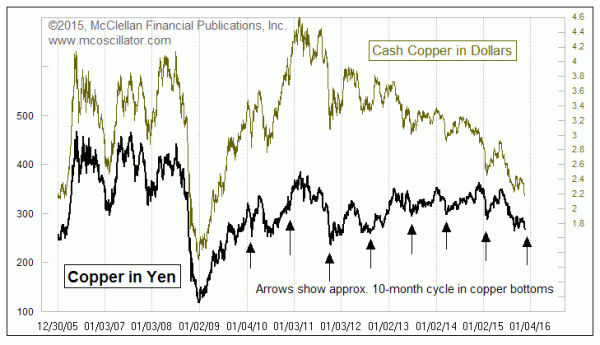
It is also obvious that the copper price in dollars has not correlated with economic growth for several years.
For investors, this means opportunity when there is general selling of stocks that are not directly related to commodities. This includes cyclical names (think Honeywell or GE), bank stocks, and technology.
For traders, the accuracy of the economic correlation really does not matter. As long as so many believe there is a relationship, and trade accordingly, we must adjust our own actions to these perceptions.
By Jeff Miller
No comments:
Post a Comment