NEW YORK ( TheStreet) -- Investors love dividend stocks.
Companies offering strong dividends typically are in the financial services, materials and utilities sectors. But these small-cap stocks with strong dividends span a variety of sectors.
That's why we generated these picks using TheStreet Ratings, TheStreet's proprietary ratings tool.
The 11 stocks have buy ratings with B- rating or better. They also have the highest annual dividend yields in their various sectors, according to TheStreet Ratings. Check out which stocks made the list. And when you're finished be sure to read about which large-cap oil stocks you should sell immediately.
TheStreet Ratings projects a stock's total return potential over a 12-month period including both price appreciation and dividends. Based on 32 major data points, TheStreet Ratings uses a quantitative approach to rating over 4,300 stocks to predict return potential for the next year. The model is both objective, using elements such as volatility of past operating revenues, financial strength, and company cash flows, and subjective, including expected equities market returns, future interest rates, implied industry outlook and forecasted company earnings.
Buying an S&P 500 stock that TheStreet Ratings rated a "buy" yielded a 16.56% return in 2014 beating the S&P 500 Total Return Index by 304 basis points. Buying a Russell 2000 stock that TheStreet Ratings rated a "buy" yielded a 9.5% return in 2014, beating the Russell 2000 index, including dividends reinvested, by 460 basis points last year. Note: Reports are dated Apr. 26, 2015. Year-to-date returns are based on April 27, 2015 closing prices. UBCP data by YCharts
UBCP data by YCharts
11. United Bancorp Inc. (UBCP)
Market Cap: $39.3 million
Sector: Financial Services/Regional Banks
Annual Dividend Yield: 4.58%
Rating: Buy, B-
Year-to-date return: -2.5%
Market Cap: $39.3 million
Sector: Financial Services/Regional Banks
Annual Dividend Yield: 4.58%
Rating: Buy, B-
Year-to-date return: -2.5%
United Bancorp, Inc. operates as the bank holding company for The Citizens Savings Bank that provides commercial and retail banking services to individuals, businesses, and other organizations in Northeastern, Eastern, Southeastern, and South Central Ohio.
"We rate UNITED BANCORP INC/OH (UBCP) a BUY. This is driven by a number of strengths, which we believe should have a greater impact than any weaknesses, and should give investors a better performance opportunity than most stocks we cover. The company's strengths can be seen in multiple areas, such as its increase in net income, expanding profit margins, growth in earnings per share and attractive valuation levels. We feel these strengths outweigh the fact that the company has had lackluster performance in the stock itself."
Highlights from the analysis by TheStreet Ratings Team goes as follows:
- The company, on the basis of net income growth from the same quarter one year ago, has significantly outperformed against the S&P 500 and exceeded that of the Commercial Banks industry average. The net income increased by 22.4% when compared to the same quarter one year prior, going from $0.60 million to $0.73 million.
- The gross profit margin for UNITED BANCORP INC/OH is currently very high, coming in at 83.08%. It has increased from the same quarter the previous year. Along with this, the net profit margin of 14.83% is above that of the industry average.
- UNITED BANCORP INC/OH has improved earnings per share by 25.0% in the most recent quarter compared to the same quarter a year ago. Stable Earnings per share over the past year indicate the company has sound management over its earnings and share float. During the past fiscal year, UNITED BANCORP INC/OH increased its bottom line by earning $0.53 versus $0.52 in the prior year.
- UBCP, with its decline in revenue, slightly underperformed the industry average of 0.4%. Since the same quarter one year prior, revenues slightly dropped by 3.5%. The declining revenue has not hurt the company's bottom line, with increasing earnings per share.
- You can view the full analysis from the report here: UBCP Ratings Report
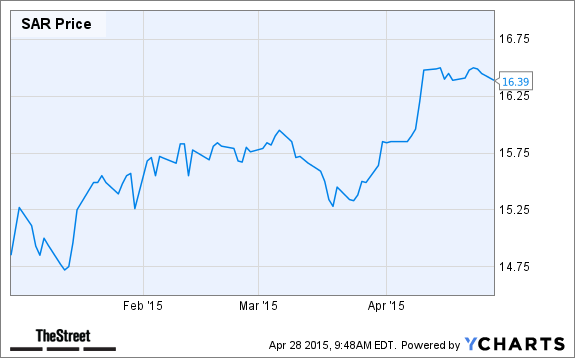
10. Saratoga Investment Corp. (SAR - Get Report)
Market Cap: $88.2 million
Sector: Financial Services/Asset Management & Custody Banks
Annual Dividend Yield: 5.33%
Rating: Buy, B-
Year-to-date return: 10.4%
Market Cap: $88.2 million
Sector: Financial Services/Asset Management & Custody Banks
Annual Dividend Yield: 5.33%
Rating: Buy, B-
Year-to-date return: 10.4%
Saratoga Investment Corp. is a business development company specializing in leveraged and management buyouts, acquisition financings, growth financings, recapitalization, debt refinancing, and transitional financing transactions at the lower end of middle market companies.
"We rate SARATOGA INVESTMENT CORP (SAR) a BUY. This is driven by several positive factors, which we believe should have a greater impact than any weaknesses, and should give investors a better performance opportunity than most stocks we cover. The company's strengths can be seen in multiple areas, such as its revenue growth, increase in stock price during the past year, increase in net income, attractive valuation levels and expanding profit margins. Although the company may harbor some minor weaknesses, we feel they are unlikely to have a significant impact on results."
Highlights from the analysis by TheStreet Ratings Team goes as follows:
- The revenue growth came in higher than the industry average of 4.6%. Since the same quarter one year prior, revenues rose by 25.9%. Growth in the company's revenue appears to have helped boost the earnings per share.
- Compared to where it was a year ago today, the stock is now trading at a higher level, reflecting both the market's overall trend during that period and the fact that the company's earnings growth has been robust. Turning our attention to the future direction of the stock, it goes without saying that even the best stocks can fall in an overall down market. However, in any other environment, this stock still has good upside potential despite the fact that it has already risen in the past year.
- The net income growth from the same quarter one year ago has significantly exceeded that of the S&P 500 and the Capital Markets industry. The net income increased by 173.6% when compared to the same quarter one year prior, rising from $1.27 million to $3.47 million.
- The gross profit margin for SARATOGA INVESTMENT CORP is rather high; currently it is at 62.68%. Despite the high profit margin, it has decreased significantly from the same period last year. Despite the mixed results of the gross profit margin, SAR's net profit margin of 47.44% significantly outperformed against the industry.
- You can view the full analysis from the report here: SAR Ratings Report
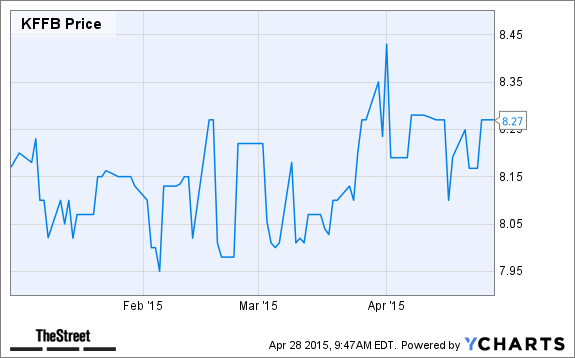
9. Kentucky First Federal Bancorp (KFFB)
Market Cap: $70 million
Sector: Financial Services/Thrifts & Mortgage Finance
Annual Dividend Yield: 4.89%
Rating: Buy, B-
Year-to-date return: 1.2%
Market Cap: $70 million
Sector: Financial Services/Thrifts & Mortgage Finance
Annual Dividend Yield: 4.89%
Rating: Buy, B-
Year-to-date return: 1.2%
Kentucky First Federal Bancorp operates as the holding company for First Federal Savings and Loan Association of Hazard, and First Federal Savings Bank of Frankfort that provide various banking and financial products and services.
"We rate KENTUCKY FIRST FEDERAL BNCRP (KFFB) a BUY. This is driven by several positive factors, which we believe should have a greater impact than any weaknesses, and should give investors a better performance opportunity than most stocks we cover. The company's strengths can be seen in multiple areas, such as its good cash flow from operations and expanding profit margins. We feel these strengths outweigh the fact that the company has had lackluster performance in the stock itself."
Highlights from the analysis by TheStreet Ratings Team goes as follows:
- Net operating cash flow has significantly increased by 102.57% to $0.79 million when compared to the same quarter last year. In addition, KENTUCKY FIRST FEDERAL BNCRP has also vastly surpassed the industry average cash flow growth rate of -184.63%.
- The gross profit margin for KENTUCKY FIRST FEDERAL BNCRP is currently very high, coming in at 83.35%. It has increased from the same quarter the previous year. Regardless of the strong results of the gross profit margin, the net profit margin of 17.08% trails the industry average.
- Regardless of the drop in revenue, the company managed to outperform against the industry average of 8.1%. Since the same quarter one year prior, revenues slightly dropped by 2.8%. Weakness in the company's revenue seems to not be hurting the bottom line, shown by stable earnings per share.
- KENTUCKY FIRST FEDERAL BNCRP reported flat earnings per share in the most recent quarter. The company has suffered a declining pattern earnings per share over the past two years. During the past fiscal year, KENTUCKY FIRST FEDERAL BNCRP reported lower earnings of $0.23 versus $0.37 in the prior year.
- The company, on the basis of change in net income from the same quarter one year ago, has significantly underperformed compared to the Thrifts & Mortgage Finance industry average, but is greater than that of the S&P 500. The net income has decreased by 3.2% when compared to the same quarter one year ago, dropping from $0.60 million to $0.58 million.
- You can view the full analysis from the report here: KFFB Ratings Report
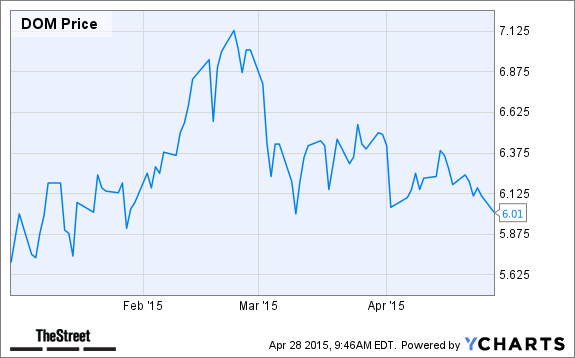
8. Dominion Resources Black Warrior Trust (DOM)
Market Cap: $47.2 million
Sector: Energy/Oil & Gas Exploration & Production
Annual Dividend Yield: 11.73%
Rating: Buy, B-
Year-to-date return: 5.4%
Market Cap: $47.2 million
Sector: Energy/Oil & Gas Exploration & Production
Annual Dividend Yield: 11.73%
Rating: Buy, B-
Year-to-date return: 5.4%
Dominion Resources Black Warrior Trust operates as a grantor trust in the United States.
"We rate DOMINION RES BLACK WARRIOR (DOM) a BUY. This is driven by a number of strengths, which we believe should have a greater impact than any weaknesses, and should give investors a better performance opportunity than most stocks we cover. The company's strengths can be seen in multiple areas, such as its revenue growth, largely solid financial position with reasonable debt levels by most measures, notable return on equity, increase in net income and expanding profit margins. We feel these strengths outweigh the fact that the company has had lackluster performance in the stock itself."
Highlights from the analysis by TheStreet Ratings Team goes as follows:
- The revenue growth came in higher than the industry average of 20.3%. Since the same quarter one year prior, revenues slightly increased by 3.7%. This growth in revenue does not appear to have trickled down to the company's bottom line, displayed by a decline in earnings per share.
- DOM has no debt to speak of therefore resulting in a debt-to-equity ratio of zero, which we consider to be a relatively favorable sign.
- The company's current return on equity greatly increased when compared to its ROE from the same quarter one year prior. This is a signal of significant strength within the corporation. Compared to other companies in the Oil, Gas & Consumable Fuels industry and the overall market, DOMINION RES BLACK WARRIOR's return on equity significantly exceeds that of both the industry average and the S&P 500.
- The net income growth from the same quarter one year ago has exceeded that of the S&P 500 and greatly outperformed compared to the Oil, Gas & Consumable Fuels industry average. The net income increased by 1.5% when compared to the same quarter one year prior, going from $1.39 million to $1.41 million.
- The gross profit margin for DOMINION RES BLACK WARRIOR is currently very high, coming in at 100.00%. DOM has managed to maintain the strong profit margin since the same quarter of last year. Despite the mixed results of the gross profit margin, DOM's net profit margin of 84.54% significantly outperformed against the industry.
- You can view the full analysis from the report here: DOM Ratings Report
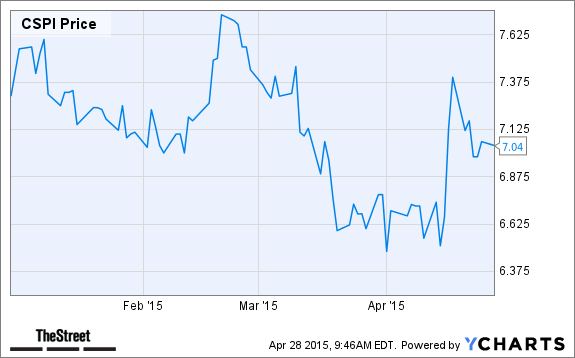
7. CSP Inc. (CSPI)
Market Cap: $25.7 million
Sector: Technology/IT Consulting & Other Services
Annual Dividend Yield: 6.3%
Rating: Buy, B-
Year-to-date return: -3.6%
Market Cap: $25.7 million
Sector: Technology/IT Consulting & Other Services
Annual Dividend Yield: 6.3%
Rating: Buy, B-
Year-to-date return: -3.6%
CSP Inc., together with its subsidiaries, develops and markets information technology (IT) integration solutions and high-performance cluster computer systems to industrial, commercial, and defense customers in the Americas, Europe, and Asia.
"We rate CSP INC (CSPI) a BUY. This is driven by a number of strengths, which we believe should have a greater impact than any weaknesses, and should give investors a better performance opportunity than most stocks we cover. The company's strengths can be seen in multiple areas, such as its largely solid financial position with reasonable debt levels by most measures and notable return on equity. We feel these strengths outweigh the fact that the company has had lackluster performance in the stock itself."
- CSPI has no debt to speak of therefore resulting in a debt-to-equity ratio of zero, which we consider to be a relatively favorable sign. To add to this, CSPI has a quick ratio of 1.70, which demonstrates the ability of the company to cover short-term liquidity needs.
- Despite the weak revenue results, CSPI has outperformed against the industry average of 20.8%. Since the same quarter one year prior, revenues slightly dropped by 4.2%. Weakness in the company's revenue seems to have hurt the bottom line, decreasing earnings per share.
- CSP INC has experienced a steep decline in earnings per share in the most recent quarter in comparison to its performance from the same quarter a year ago. This company has not demonstrated a clear trend in earnings over the past 2 years, making it difficult to accurately predict earnings for the coming year. During the past fiscal year, CSP INC increased its bottom line by earning $0.38 versus $0.10 in the prior year.
- The return on equity has improved slightly when compared to the same quarter one year prior. This can be construed as a modest strength in the organization. Compared to other companies in the IT Services industry and the overall market, CSP INC's return on equity significantly trails that of both the industry average and the S&P 500.
- The gross profit margin for CSP INC is rather low; currently it is at 20.20%. It has decreased from the same quarter the previous year. Along with this, the net profit margin of -2.13% is significantly below that of the industry average.
- You can view the full analysis from the report here: CSPI Ratings Report
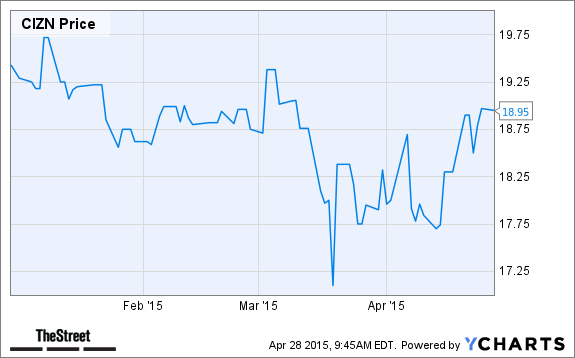
6. Citizens Holding Co. (CIZN - Get Report)
Market Cap: $92.4 million
Sector: Financial Services/Regional Banks
Annual Dividend Yield: 4.89%
Rating: Buy, B-
Year-to-date return: -0.25%
Market Cap: $92.4 million
Sector: Financial Services/Regional Banks
Annual Dividend Yield: 4.89%
Rating: Buy, B-
Year-to-date return: -0.25%
Citizens Holding Company operates as the bank holding company for The Citizens Bank of
Philadelphia that provides commercial and personal banking products and services in Mississippi, the United States.
"We rate CITIZENS HOLDING CO (CIZN) a BUY. This is driven by a number of strengths, which we believe should have a greater impact than any weaknesses, and should give investors a better performance opportunity than most stocks we cover. The company's strongest point has been its very decent return on equity which we feel should persist. We feel these strengths outweigh the fact that the company has had lackluster performance in the stock itself."
Highlights from the analysis by TheStreet Ratings Team goes as follows:
- CITIZENS HOLDING CO's earnings per share declined by 10.8% in the most recent quarter compared to the same quarter a year ago. This company has not demonstrated a clear trend in earnings over the past 2 years, making it difficult to accurately predict earnings for the coming year. During the past fiscal year, CITIZENS HOLDING CO increased its bottom line by earning $1.53 versus $1.47 in the prior year.
- The change in net income from the same quarter one year ago has exceeded that of the S&P 500, but is less than that of the Commercial Banks industry average. The net income has decreased by 11.3% when compared to the same quarter one year ago, dropping from $1.80 million to $1.59 million.
- In its most recent trading session, CIZN has closed at a price level that was not very different from its closing price of one year earlier. This is probably due to its weak earnings growth as well as other mixed factors. Looking ahead, although the push and pull of the overall market trend could certainly make a critical difference, we do not see any strong reason stemming from the company's fundamentals that would cause a continuation of last year's decline. In fact, the stock is now selling for less than others in its industry in relation to its current earnings.
- The company's current return on equity has slightly decreased from the same quarter one year prior. This implies a minor weakness in the organization. When compared to other companies in the Commercial Banks industry and the overall market, CITIZENS HOLDING CO's return on equity is below that of both the industry average and the S&P 500.
- You can view the full analysis from the report here: CIZN Ratings Report

5. Digirad Corp. (DRAD - Get Report)
Market Cap: $87.7 million
Sector: Health Care/Health Care Equipment
Annual Dividend Yield: 4.35%
Rating: Buy, B
Year-to-date return: 4.6%
Market Cap: $87.7 million
Sector: Health Care/Health Care Equipment
Annual Dividend Yield: 4.35%
Rating: Buy, B
Year-to-date return: 4.6%
Digirad Corporation provides diagnostic solutions in the United States. The company operates in two segments, Diagnostic Services and Diagnostic Imaging.
"We rate DIGIRAD CORP (DRAD) a BUY. This is driven by multiple strengths, which we believe should have a greater impact than any weaknesses, and should give investors a better performance opportunity than most stocks we cover. The company's strengths can be seen in multiple areas, such as its revenue growth, largely solid financial position with reasonable debt levels by most measures, solid stock price performance and notable return on equity. We feel these strengths outweigh the fact that the company has had sub par growth in net income."
Highlights from the analysis by TheStreet Ratings Team goes as follows:
- The revenue growth came in higher than the industry average of 0.6%. Since the same quarter one year prior, revenues rose by 12.9%. This growth in revenue does not appear to have trickled down to the company's bottom line, displaying stagnant earnings per share.
- DRAD's debt-to-equity ratio is very low at 0.02 and is currently below that of the industry average, implying that there has been very successful management of debt levels. Along with this, the company maintains a quick ratio of 3.43, which clearly demonstrates the ability to cover short-term cash needs.
- Compared to its closing price of one year ago, DRAD's share price has jumped by 39.51%, exceeding the performance of the broader market during that same time frame. We feel that the stock's sharp appreciation over the last year has driven it to a price level which is now somewhat expensive compared to the rest of its industry. The other strengths this company shows, however, justify the higher price levels.
- DIGIRAD CORP reported flat earnings per share in the most recent quarter. This company has not demonstrated a clear trend in earnings over the past 2 years, making it difficult to accurately predict earnings for the coming year. During the past fiscal year, DIGIRAD CORP increased its bottom line by earning $0.12 versus $0.02 in the prior year.
- Current return on equity exceeded its ROE from the same quarter one year prior. This is a clear sign of strength within the company. When compared to other companies in the Health Care Equipment & Supplies industry and the overall market, DIGIRAD CORP's return on equity is below that of both the industry average and the S&P 500.
- You can view the full analysis from the report here: DRAD Ratings Report

4. Bowl America Inc. (BWL.A - Get Report)
Market Cap: $73.6 million
Sector: Consumer Goods & Services/Leisure Facilities
Annual Dividend Yield: 4.76%
Rating: Buy, B
Year-to-date return: -0.35%
Market Cap: $73.6 million
Sector: Consumer Goods & Services/Leisure Facilities
Annual Dividend Yield: 4.76%
Rating: Buy, B
Year-to-date return: -0.35%
Bowl America Incorporated, together with its subsidiaries, operates bowling centers in the United States.
"We rate BOWL AMERICA INC (BWL.A) a BUY. This is driven by multiple strengths, which we believe should have a greater impact than any weaknesses, and should give investors a better performance opportunity than most stocks we cover. The company's strengths can be seen in multiple areas, such as its revenue growth, increase in net income, good cash flow from operations, largely solid financial position with reasonable debt levels by most measures and growth in earnings per share. We feel these strengths outweigh the fact that the company has had lackluster performance in the stock itself."
Highlights from the analysis by TheStreet Ratings Team goes as follows:
- BWL.A's revenue growth has slightly outpaced the industry average of 7.9%. Since the same quarter one year prior, revenues slightly increased by 0.1%. This growth in revenue appears to have trickled down to the company's bottom line, improving the earnings per share.
- The net income growth from the same quarter one year ago has significantly exceeded that of the S&P 500 and the Hotels, Restaurants & Leisure industry. The net income increased by 29.9% when compared to the same quarter one year prior, rising from $0.37 million to $0.48 million.
- Net operating cash flow has increased to $1.65 million or 11.48% when compared to the same quarter last year. In addition, BOWL AMERICA INC has also vastly surpassed the industry average cash flow growth rate of -74.97%.
- BWL.A has no debt to speak of therefore resulting in a debt-to-equity ratio of zero, which we consider to be a relatively favorable sign. Despite the fact that BWL.A's debt-to-equity ratio is low, the quick ratio, which is currently 0.65, displays a potential problem in covering short-term cash needs.
- BOWL AMERICA INC has improved earnings per share by 28.6% in the most recent quarter compared to the same quarter a year ago. This company has not demonstrated a clear trend in earnings over the past 2 years, making it difficult to accurately predict earnings for the coming year. During the past fiscal year, BOWL AMERICA INC reported lower earnings of $0.27 versus $0.30 in the prior year.
- You can view the full analysis from the report here: BWL.A Ratings Report
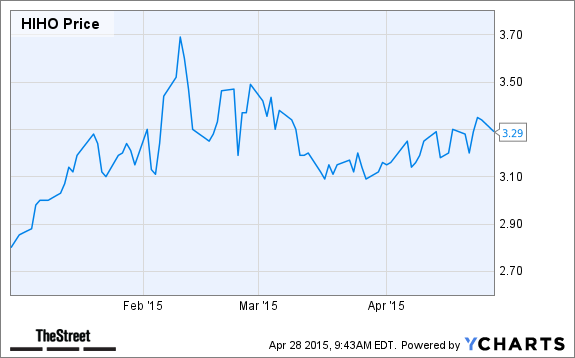
3. Highway Holdings Ltd. (HIHO)
Market Cap: $12.5 million
Sector: Consumer Goods & Services/Leisure Facilities
Annual Dividend Yield: 11.94%
Rating: Buy, A-
Year-to-date return: 17.5%
Market Cap: $12.5 million
Sector: Consumer Goods & Services/Leisure Facilities
Annual Dividend Yield: 11.94%
Rating: Buy, A-
Year-to-date return: 17.5%
Highway Holdings Limited, through its subsidiaries, manufactures and sells metal, plastic, electric, and electronic components, subassemblies, and finished products for original equipment manufacturers (OEM) and contract manufacturers.
"We rate HIGHWAY HOLDINGS LTD (HIHO) a BUY. This is based on the convergence of positive investment measures, which should help this stock outperform the majority of stocks that we rate. The company's strengths can be seen in multiple areas, such as its revenue growth, largely solid financial position with reasonable debt levels by most measures, solid stock price performance, impressive record of earnings per share growth and compelling growth in net income. We feel these strengths outweigh the fact that the company shows low profit margins."
Highlights from the analysis by TheStreet Ratings Team goes as follows:
- The revenue growth came in higher than the industry average of 9.6%. Since the same quarter one year prior, revenues slightly increased by 3.2%. This growth in revenue appears to have trickled down to the company's bottom line, improving the earnings per share.
- HIHO has no debt to speak of therefore resulting in a debt-to-equity ratio of zero, which we consider to be a relatively favorable sign. Along with this, the company maintains a quick ratio of 3.05, which clearly demonstrates the ability to cover short-term cash needs.
- Looking at where the stock is today compared to one year ago, we find that it is not only higher, but it has also clearly outperformed the rise in the S&P 500 over the same period. Although other factors naturally played a role, the company's strong earnings growth was key. Turning our attention to the future direction of the stock, it goes without saying that even the best stocks can fall in an overall down market. However, in any other environment, this stock still has good upside potential despite the fact that it has already risen in the past year.
- HIGHWAY HOLDINGS LTD reported significant earnings per share improvement in the most recent quarter compared to the same quarter a year ago. The company has demonstrated a pattern of positive earnings per share growth over the past two years. During the past fiscal year, HIGHWAY HOLDINGS LTD increased its bottom line by earning $0.16 versus $0.12 in the prior year.
- The net income growth from the same quarter one year ago has significantly exceeded that of the S&P 500 and the Machinery industry. The net income increased by 143.9% when compared to the same quarter one year prior, rising from $0.15 million to $0.36 million.
- You can view the full analysis from the report here: HIHO Ratings Report

2. Mind C.T.I. Ltd. (MNDO)
Market Cap: $52 million
Sector: Technology/Application Software
Annual Dividend Yield: 7.84%
Rating: Buy, A
Year-to-date return: -31%
Market Cap: $52 million
Sector: Technology/Application Software
Annual Dividend Yield: 7.84%
Rating: Buy, A
Year-to-date return: -31%
MIND C.T.I. Ltd., together with its subsidiaries, develops, manufactures, implements, and markets real-time and off-line billing and customer care software solutions in the Americas, the Asia Pacific, Africa, Europe, and Israel.
"We rate MIND CTI LTD (MNDO) a BUY. This is based on the convergence of positive investment measures, which should help this stock outperform the majority of stocks that we rate. The company's strengths can be seen in multiple areas, such as its robust revenue growth, largely solid financial position with reasonable debt levels by most measures, notable return on equity, attractive valuation levels and solid stock price performance. We feel these strengths outweigh the fact that the company shows weak operating cash flow."
Highlights from the analysis by TheStreet Ratings Team goes as follows:
- The revenue growth came in higher than the industry average of 0.7%. Since the same quarter one year prior, revenues rose by 28.2%. This growth in revenue appears to have trickled down to the company's bottom line, improving the earnings per share.
- MNDO has no debt to speak of therefore resulting in a debt-to-equity ratio of zero, which we consider to be a relatively favorable sign. Along with this, the company maintains a quick ratio of 3.36, which clearly demonstrates the ability to cover short-term cash needs.
- The company's current return on equity greatly increased when compared to its ROE from the same quarter one year prior. This is a signal of significant strength within the corporation. Compared to other companies in the Software industry and the overall market, MIND CTI LTD's return on equity significantly exceeds that of both the industry average and the S&P 500.
- Powered by its strong earnings growth of 100.00% and other important driving factors, this stock has surged by 58.54% over the past year, outperforming the rise in the S&P 500 Index during the same period. Regarding the stock's future course, although almost any stock can fall in a broad market decline, MNDO should continue to move higher despite the fact that it has already enjoyed a very nice gain in the past year.
- You can view the full analysis from the report here: MNDO Ratings Report
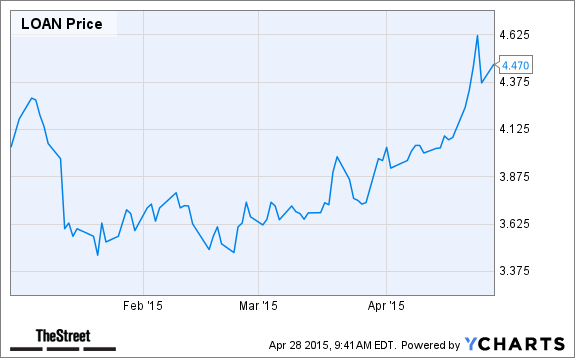
1. Manhattan Bridge Capital Inc. (LOAN - Get Report)
Market Cap: $27.2 million
Sector: Financial Services/Specialized Finance
Annual Dividend Yield: 6.06%
Rating: Buy, A
Year-to-date return: 11%
Market Cap: $27.2 million
Sector: Financial Services/Specialized Finance
Annual Dividend Yield: 6.06%
Rating: Buy, A
Year-to-date return: 11%
Manhattan Bridge Capital, Inc., a real estate finance company, originates, services, and manages a portfolio of first mortgage loans in the United States.
"We rate MANHATTAN BRIDGE CAPITAL INC (LOAN) a BUY. This is based on the convergence of positive investment measures, which should help this stock outperform the majority of stocks that we rate. The company's strengths can be seen in multiple areas, such as its robust revenue growth, solid stock price performance, impressive record of earnings per share growth, compelling growth in net income and attractive valuation levels. Although the company may harbor some minor weaknesses, we feel they are unlikely to have a significant impact on results."
Highlights from the analysis by TheStreet Ratings Team goes as follows:
- LOAN's very impressive revenue growth greatly exceeded the industry average of 2.4%. Since the same quarter one year prior, revenues leaped by 53.1%. This growth in revenue appears to have trickled down to the company's bottom line, improving the earnings per share.
- Powered by its strong earnings growth of 200.00% and other important driving factors, this stock has surged by 147.05% over the past year, outperforming the rise in the S&P 500 Index during the same period. Regarding the stock's future course, although almost any stock can fall in a broad market decline, LOAN should continue to move higher despite the fact that it has already enjoyed a very nice gain in the past year.
- MANHATTAN BRIDGE CAPITAL INC reported significant earnings per share improvement in the most recent quarter compared to the same quarter a year ago. The company has demonstrated a pattern of positive earnings per share growth over the past two years. During the past fiscal year, MANHATTAN BRIDGE CAPITAL INC increased its bottom line by earning $0.29 versus $0.15 in the prior year.
- The net income growth from the same quarter one year ago has significantly exceeded that of the S&P 500 and the Diversified Financial Services industry. The net income increased by 584.5% when compared to the same quarter one year prior, rising from $0.06 million to $0.40 million.
- You can view the full analysis from the report here: LOAN Ratings Report
By Laurie Kulikowski
No comments:
Post a Comment