3 comments | Includes: INCO, INXX, SCIN
Disclosure: The author has no positions in any stocks mentioned, and no plans to initiate any positions within the next 72 hours.
Summary
- Since the May 2014 election of Prime Minister Narendra Modi, India has outperformed other emerging markets in response to a strong reform agenda1.
- Reasons investors should consider India include reforms, GDP growth, fiscal discipline, earnings growth and favorable valuations.
- Investors considering equity allocations to India should keep in mind potential growth in the consumer, infrastructure, and economically sensitive companies, such as small cap companies.
Since the historic election of Indian Prime Minister Narendra Modi last May, India's market has shown few signs of slowing down. In 2014, India was the best-performing emerging market, up more than 29%, and it continues to outperform this year as well.2 We believe the market has responded favorably to the robust agenda of reform under the Modi administration, as many believe his policies will enhance India's economic potential.
There are numerous reasons why investors should consider India now and over the long term. Here, we highlight the five key reasons to invest in India right now.
1. Reforms matter
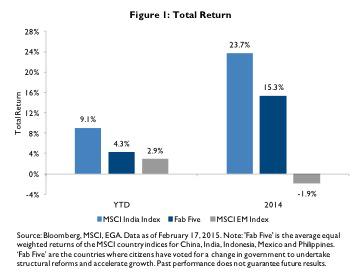
Those emerging market countries that are actively undertaking reform, which we call the "Fab Five" (India, Indonesia, Mexico, Philippines and China), are expected to revive economic growth. Investors are eager to see reforms carried out as a growth catalyst and have rewarded countries such as India (see Figure 1).
The reforms put forth by the new Indian government under Prime Minister Modi intend to privatize state assets (especially the financials and power sectors), increase foreign direct investment, reduce the fiscal deficit by cutting subsidies, deregulate the labor market, upgrade infrastructure and reform the tax regime. We believe these improvements should unleash investment, increase efficiency, raise productivity and boost growth.
2. Favorable demographics and Gross Domestic Product [GDP] growth
The world's largest democracy, India is home to 1.25 billion people, with more than 65% of the population younger than 35. By 2025, India is projected to be the world's most populous country with almost 1.4 billion people. In addition to its population, India's total labor force will continue to grow relatively quickly, by about 1.5% annually. By 2030, there will be about 174 million net new members of the country's labor force.4
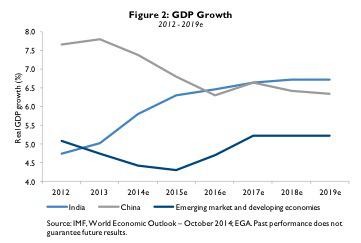
Furthermore, India's GDP is expected to expand more this year, and is forecasted to be 6.3%, compared to 4.3% in emerging and developing economies (see Figure 2).5 By 2016, India's GDP is expected to surpass China's. Today, growth opportunities are very scarce within emerging markets and India is a rare growth opportunity for investors.
3. Fiscal and monetary discipline
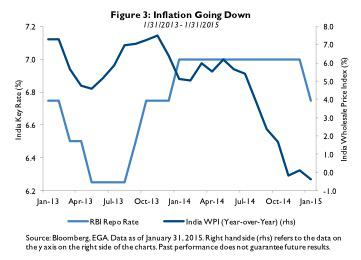
The lower price of oil and better fiscal management, including cutting government subsidies, are helping to reduce India's fiscal deficit. India is also focused on managing inflation, which helps the central bank to lower interest rates (see Figure 3). In particular, a strengthening rupee prevents the erosion of return for U.S. investors. Collectively, lower interest rates, lower inflation and lower commodity prices all help to put money in the pockets of consumers and accelerate domestic demand growth.
4. The growth of corporate earnings
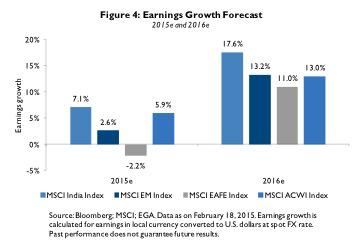
Consensus estimates for corporate earnings in emerging markets are improving over the next two years, and estimates for India are better still. In 2016, India's earnings growth is forecasted to increase to almost 20%, up from a projected 7% in 2015 (see Figure 4). India earnings are forecasted to surpass not only the MSCI ACWI index, but also the rest of emerging markets and the MSCI EAFE Index.
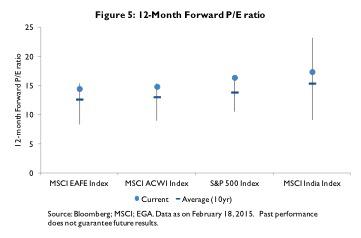
5. It's not too late
India's current forward valuation levels point to sustainable growth at a reasonable price over the long term, relative to other global equity benchmarks and in relation to its own growth rate. India's valuation is only slightly above its 10-year average and similar to that of the S&P 500 Index. The country's 12-month forward price-to-earnings (P/E) ratio is about 17.4% (see Figure 5) and its price-to-earnings growth [PEG] ratio is 1.5 - in line with Taiwan and China, and arguably more attractive than energy markets as a whole.
Investment Opportunities
We believe there is an opportunity for investors to focus on three specific themes in India: domestic demand and consumption, infrastructure, and small and mid caps. These themes are among the areas of the Indian economy best poised to benefit from the Modi administration's agenda of reform.
First, India is a significant net importer of oil and a top beneficiary of low oil prices; therefore, falling prices should support domestic demand by supplying consumers with more discretionary income. To tap into this growth in consumption, investors might consider the EGShares India Consumer ETF (NYSE: INCO), with Consumer Goods comprising nearly 80% of a maximum 30-stock market cap-weighted index. The top sectors within INCO include automobiles and parts, personal goods and industrial engineering. INCO is currently the only India-focused ETF with a five-star rating from Morningstar among 16 India Equity ETFs and open-end funds as of 2/28/2015 based on risk-adjusted return.
Second, infrastructure was a significant focus of Indian Finance Minister Arun Jaitley's February 28, 2015 budget speech, where he stated India would spend an additional $11 billion on roads, railways, ports and other projects next year. The EGShares India Infrastructure Exchange-Traded Fund (NYSEMKT:ETF) (NYSE: INXX), designed to provide exposure to the anticipated growth in spending on infrastructure. The companies selected for the fund's underlying index may be positioned to benefit since they include, among other industries, construction and engineering, construction materials, independent power producers, metals and mining, and wireless telecommunications services.
Third, India's large cap companies have underperformed mid- and small-caps, highlighting the opportunity for investors to access the growth in Indian small caps. The EGShares India Small Cap ETF (NYSE: SCIN) offers targeted exposure to a maximum of 75 Indian companies with a market capitalization between $100 million and $2 billion.
Footnotes
1 Prime Minister Modi took office 5/26/2014. From 5/26/2014 - 3/12/2015, the MSCI India Index was up 19.5% compared to the broad MSCI Emerging Markets Index which was down -3.2%. Source: MSCI, Bloomberg as of 3/13/2015.
2 From 12/31/2013 - 12/31/2014, the MSCI India Index was up 23.7% compared to the broad MSCI Emerging Markets Index which was down -2.1%. From 12/31/2014 - 3/12/2015, the MSCI India Index was up 7.7% compared to the broad MSCI Emerging Markets Index which was up 3.7%. Source: MSCI, Bloomberg.
3 Source: FA Magazine, "Five Reasons to Buy India ETFs Even After Last Year's Monster Rally," January 28, 2015.
4 Ibid.
5 Source: International Monetary Fund (NYSE:IMF), WEO - October 2014; EGA.
Definitions
India Key Rate is also known as the RBI Repo Rate as all other rates can be derived from the repo rate. India WPI is the Wholesale Price Index of India and is the price of a representative basket of wholesale goods; it is used to measure inflation. Indxx India Consumer Index is a maximum 30-stock free-float adjusted market capitalization-weighted index designed to measure the market performance of companies in the consumer industry in India.Indxx India Infrastructure Index is a maximum 30-stock free-float adjusted market capitalization-weighted index designed to measure the market performance of companies in the infrastructure industry in India.Indxx India Small Cap Index is a maximum 75-stock free-float adjusted market capitalization-weighted index designed to measure the market performance of companies in the small cap segment in India. MSCI All Country World Index (NASDAQ:ACWI) captures large and mid-cap representation across 23 developed markets (NYSE:DM) and 23 emerging markets (NYSE:EM) countries. MSCI China Index captures large and mid cap representation across China H shares, B shares, Red chips and P chips. MSCI Emerging Markets Index is an index that is designed to measure the equity market performance in global emerging markets. MSCI Europe, Australasia, Far East (EAFE) Index captures large and mid-cap representation across developed markets countries around the world, excluding the U.S. and Canada. MSCI India Index is a free-float adjusted market capitalization weighted index that is designed to track the equity market performance of Indian securities listed on the National Stock Exchange and the Bombay Stock Exchange. MSCI Indonesia Index is designed to track the performance of Indonesian securities listed on the Indonesia Stock Exchange. MSCI Mexico Index is designed to measure the performance of the large and mid cap segments of the Mexican market. MSCI Philippines Index is a free-float adjusted market capitalization weighted index that is designed to track the equity market performance of Philippine securities listed on the Philippine Stock Exchange. PEG Ratio is the price to earnings ratio divided by the growth rate of its earnings for a specified time period. Price/Earnings (P/E) Ratio (Forward) is the sum of Bloomberg consensus estimates for the future 12-month earnings of the equity holdings, divided by the total market value of the equity holdings. Both positive and negative earnings are included in the calculation. S&P 500 Index is a broad-based measure of U.S. stock market performance.
Important Disclosures
Investors should carefully consider the investment objectives, risks, charges and expenses of a Fund before investing. To obtain a prospectus for any EGA or EGShares Funds and other important information, as well as to obtain most recent index performance, please call +1 888 800 4347 or visit emergingglobaladvisors.com to view or download a prospectus. Read the prospectus carefully before investing.
Index returns are for illustrative purposes only and do not represent actual fund performance. Index performance returns do not reflect any management fees, transaction costs or expenses, which could reduce returns. Indexes are unmanaged and one cannot invest directly in an index. Performance data quoted represents past performance. Past performance does not guarantee future results. Current performance data may be higher or lower than actual data quoted. For the most current index performance data please call + 1 888 800 4347.
Emerging market investments involve risk of capital loss from unfavorable fluctuation in currency values, from differences in generally accepted accounting principles, from economic or political instability in other nations or increased volatility, and lower trading volume. The value of an investment denominated in a foreign currency could change significantly as foreign currencies strengthen or weaken relative to the U.S. dollar.
Frontier markets countries generally have smaller economies or less developed capital markets than in more advanced developing markets and, as a result, the risks of investing in developing markets countries are magnified in frontier markets countries.
Diversification does not assure a profit nor protect against a loss.
The EGShares India Consumer ETF seeks investment results that correspond (before fees and expenses) to the price and yield performance of the Indxx India Consumer Index. The EGShares India Infrastructure ETF seeks investment results that correspond (before fees and expenses) to the price and yield performance of the Indxx India Infrastructure Index. The EGShares India Small Cap ETF seeks investment results that correspond (before fees and expenses) to the price and yield performance of the Indxx India Small Cap Index.
The Morningstar Rating® is provided for those exchange-traded funds ("ETFs") with at least a three-year history. Ratings are based on the ETF's Morningstar Risk-Adjusted Return measure, which accounts for variation in monthly performance, placing more emphasis on downward variations and rewarding consistent performance. An ETF's risk-adjusted return includes a brokerage commission estimate. This estimate is intended to reflect what an average investor would pay when buying or selling an ETF. PLEASE NOTE, this estimate is subject to change and the actual brokerage commission an investor pays may be higher or lower than this estimate. Morningstar compares each ETF's risk-adjusted return to the open-end mutual fund rating breakpoints for that category. Consistent with the open-end mutual fund ratings, the top 10% of ETFs in each category receive 5 stars, the next 22.5% receive 4 stars, the next 35% receive 3 stars, the next 22.5% receive 2 stars and the bottom 10% receive 1 star. The overall rating for an ETF is based on a weighted average of the time-period ratings (e.g., the ETF's 3, 5, and 10 year rating). The determination of an ETF's rating does not affect the retail open end mutual fund data published by Morningstar. Morningstar Rating is for the ETF share class only; other classes may have different performance characteristics. As of 2/28/2015, EGShares India Consumer ETF was rated 5 stars out of 16 U.S.-domiciled India Equity ETFs and open-end funds for the overall and three-year periods. Past performance is no guarantee of future results. Morningstar, Inc. is an independent investment research firm that compiles and analyzes fund, stock and general market data.
© 2015 Morningstar, Inc. All Rights Reserved. The information contained herein: (1) is proprietary to Morningstar and/or its content providers; (2) may not be copied or distributed; and (3) is not warranted to be accurate, complete or timely. Neither Morningstar nor its content providers are responsible for any damages or losses arising from any use of this information.
"Indxx" is a service mark of Indxx, Inc. and have been licensed for use for certain purposes by EGShares. The Fund is not sponsored, endorsed, sold or promoted by Indxx. Indxx, Inc. makes no representation or warranty, express or implied, to the owners of the Fund or any member of the public regarding the advisability of investing in securities generally or in the Fund particularly. Indxx Inc's only relationship to EGShares is the licensing of certain trademarks, trade names and service marks of Indxx and of the Underlying Indices, which are determined, composed and calculated by Indxx, Inc. without regard to EGShares or the Fund. Indxx has no obligation to take the needs of EGShares or the shareholders of the Fund into consideration in determining, composing or calculating the Underlying Indices. Indxx Inc. is not responsible for and has not participated in the determination of the timing, amount or pricing of the Fund Shares to be issued or in the determination or calculation of the equation by which the Fund Shares are to be converted into cash. Indxx Inc. has no obligation or liability in connection with the administration, marketing or trading of the Fund. One cannot invest directly in an index.
Indxx Inc. does not guarantee the accuracy and/or the completeness of the Underlying Indices or any data included therein and Indxx Inc. shall have no liability for any errors, omissions, or interruptions therein. Indxx Inc. makes no warranty, express or implied, as to results to be obtained by EGShares, shareholders of the Fund, or any other person or entity from the use of the Underlying Indices or any data included therein. Indxx Inc. makes no express or implied warranties, and expressly disclaims all warranties of merchantability or fitness for a particular purpose or use with respect to the Underlying Indices or any data included therein. Without limiting any of the foregoing, in no event shall Indxx Inc. have any liability for any lost profits or indirect, punitive, special or consequential damages or losses, even if notified of the possibility thereof. There are no third party beneficiaries of any agreements or arrangements between Indxx Inc. and EGShares. Shares of the Fund are bought and sold at market price (not NAV) and are not individually redeemed from the Fund. Brokerage commissions will reduce returns. One cannot directly invest in an index.
The content of this report is presented for general information purposes only. The statements and opinions expressed are those of the author and are as of the date of this report. All information is historical and not indicative of future results, and subject to change. Reader should not assume that an investment in the securities mentioned above was or would be profitable in the future. This information is not a recommendation to buy or sell. While the information and statistical data contained herein are based on sources believed to be reliable, we do not represent that it is accurate and it should not be relied on as such or be the basis for an investment decision. This report may include estimates, projections and other "forward-looking statements". Emerging Global Advisors, LLC assumes no duty to update any such statements. Due to numerous factors, actual events may differ substantially from those presented.
ETF shares are not individually redeemable and owners of the shares may acquire those shares from the Funds and tender those shares for redemption to the Fund in Creation Units only, typically consisting of aggregations of 50,000 shares.
EGA℠, EGShares℠ and EGAI℠ are service marks of Emerging Global Advisors, LLC. All other trademarks, service marks or registered trademarks are the property of their respective owners.
EGA and EGShares Funds are distributed by ALPS Distributors, Inc. Emerging Global Advisors and ALPS are unaffiliated.
EGS002302 | Expires 3/15/2016
No comments:
Post a Comment