- Income of at least 6%
- Total return comparable to the S&P 500
- Volatility less than the S&P 500
I began my quest for this portfolio by using the fund screener atCEFConnect.com to select the 50 CEFs that had the largest year-to-date price increases. I then narrowed the list by applying the following selection criteria:
- I wanted to analyze CEFs over a complete bear and bull market cycle, so I chose CEFs that had a history going back to 12 October 2007 (the start of the 2008 bear market).
- The CEFs had to be liquid, with an average trading volume of at least 50,000 shares per day
- The distribution had to be at least 6%
- The premium had to be less than 5%
- The Market Capitalization had to be at least $100 million
Based on these criteria, I narrowed the list to 20 CEFs. I then use a look-back period that encompassed 12 October 2007 to the present. During this period, I analyzed the risk versus return characteristics and deleted those CEFs that were clearly inferior. I also deleted the candidates that were highly correlated with one another. After applying these criteria, I was left with the 8 CEFs described below.
- Dow 30 Enhanced Premium & Income (DPO): This CEF sells at a 5% discount and has a yield of 7%. The fund consists of the 30 stocks within the Dow Jones Industrial Average. In order to enhance income, the fund sells covered calls and other options (on roughly 50% of the holdings). It also uses 20% leverage to increase returns. It has an expense ratio of 1%.
- Gabelli Equity Trust (GAB): This fund sells at a 2% premium and has an 8.1% distribution. This fund utilizes a strict value methodology and has been managed by the founder, Mario Gabelli, since its inception in 1986. Mr. Gabelli also owns, directly or indirectly, about 1.6 million shares of the fund. The fund holds 396 holdings, with about 80% invested in US firms. It uses 24% leverage and has an expense ratio of 1.5%.
- Clough Global Equity (GLQ): This CEF sells at an 11% discount and has a distribution of 7.5%. The managers have a flexible mandate and can invest worldwide. Currently, 86% of the portfolio is US based, with substantial investments in Consumer Discretionary, Healthcare, and the Information Technology sectors. It has a total of 227 holdings. The fund employs 33% leverage and has a relatively high expense ratio of 3.2%.
- H&Q Healthcare Investor (HQH): This fund sells at a premium of 2% and has a distribution of 6.7%. It has 93 holdings focused on healthcare, including biotechnology, medical devices, and pharmaceuticals. It does not use leverage but many of holdings are smaller, emerging companies. It has an expense ratio of 1.4%.
- Nuveen Core Equity Alpha (JCE): This CEF sells at a discount of 6% and has a distribution of 6.8%. It has 296 holdings selected from the S&P 500 by using a proprietary mathematical algorithm. The formula attempts to add "alpha" by generating returns better than the S&P 500. It does not employ leverage and has a 1% expense ratio.
- Kayne Anderson MLP (KYN): This fund sells at a 4% premium and has a distribution of 6.3%. It has 49 holdings, all of which are Master Limited Partnerships (MLPS). The top ten holdings account for almost 50% of the total assets. It employs 32% leverage and has a high 4.4% expense ratio (including interest payments).
- LMP Capital & Income (SCD): This CEF sells at an 8% discount and has a 7.2% distribution. It has 96 holdings, spread among general equity, MLPs, convertible bonds and general bonds. Typically it has a 75% to 25% split between equity and fixed income. It employs 23% leverage and has a 1.5% expense ratio.
Assuming equal weight, these CEFs average over 7% annual distributions, so they definitely satisfied my criteria for high income. To analyze risks and return, I used the Smartfolio 3 program. Figure 1 provides the rate of return in excess of the risk free rate of return (called Excess Mu on the charts) plotted against the historical volatility over a complete market cycle from 12 October 2007 to the present. The SPDR S&P 500 ETF (SPY) is also shown for reference.
(click to enlarge)
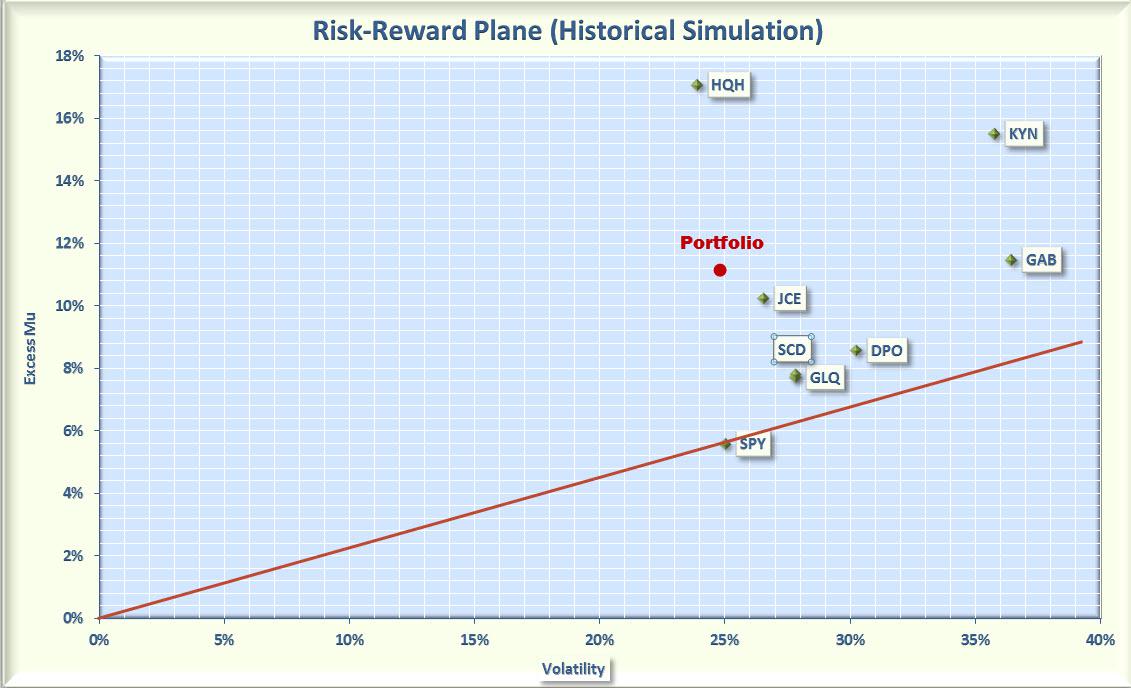
Figure 1. Risk vs. Reward for CEFs since 12 October 2012
As is evident from the figure, there was a relatively large range of returns and volatilities. For example, GAB had a high rate of return but also had a high volatility. Was the increased return worth the increased volatility? To answer this question, I calculated the Sharpe Ratio.
The Sharpe Ratio is a metric, developed by Nobel laureate William Sharpe that measures risk-adjusted performance. It is calculated as the ratio of the excess return over the volatility. This reward-to-risk ratio (assuming that risk is measured by volatility) is a good way to compare peers to assess if higher returns are due to superior investment performance or from taking additional risk. In Figure 1, I plotted a red line that represents the Sharpe Ratio associated with SPY. If an asset is above the line, it has a higher Sharpe Ratio than SPY. Conversely, if an asset is below the line, the reward-to-risk is worse than SPY.
Over the period of interest, all my selected CEFs had better risk adjusted returns than the S&P 500. This was a promising start to constructing my 'ideal" portfolio.
The next step was to combine these 7 CEFs into an equally weighted portfolio and assess how the combined portfolio performed. The risk versus reward of the combined portfolio is shown as a "red dot" on the figure.
As you can see, the combined portfolio had a volatility that was less than most of the constituent volatilities. This is an illustration of an amazing discovery made by an economist named Markowitz in 1950. He found that if you combined certain types of risky assets, you could construct a portfolio that had less risk than the components. His work was so revolutionary that he was awarded the Nobel Prize. One of the keys to achieving this reduction in risk is to have a "diversified" portfolio.
To be "diversified," you want to choose assets such that when some assets are down, others are up. In mathematical terms, you want to select assets that are uncorrelated (or at least not highly correlated) with each other. I calculated the pairwise correlations associated with the selected CEFs. The results are shown in Figure 2. A few of the CEFs are moderately correlated (about 80%) but none are highly correlated. Except for JCE, the CEFs are also not highly correlated with the SPY.
(click to enlarge)
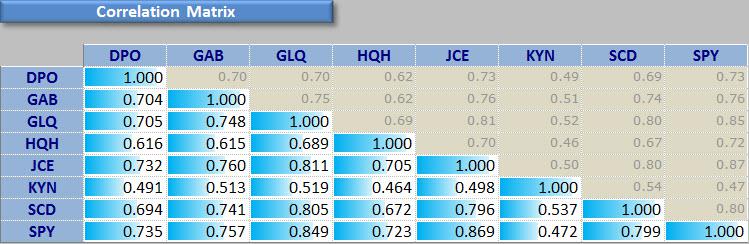
Figure 2. Correlation Matrix CEFs (12 October 2007 to present)
By combining this group of diversified CEFs, I constructed a high income CEF portfolio that beat the S&P in both total return and risk. My original objective was accomplished! This performance was achieved over a complete market cycle that included both bear and bull markets but the next question was: would the relationship hold during the recent past, when the S&P was enjoying a rip roaring bull market?
To check to see if the good performance still held over shorter time periods, I reduced the look back period to 3 years and re-ran the analysis. The results are shown in Figure 3.
(click to enlarge)
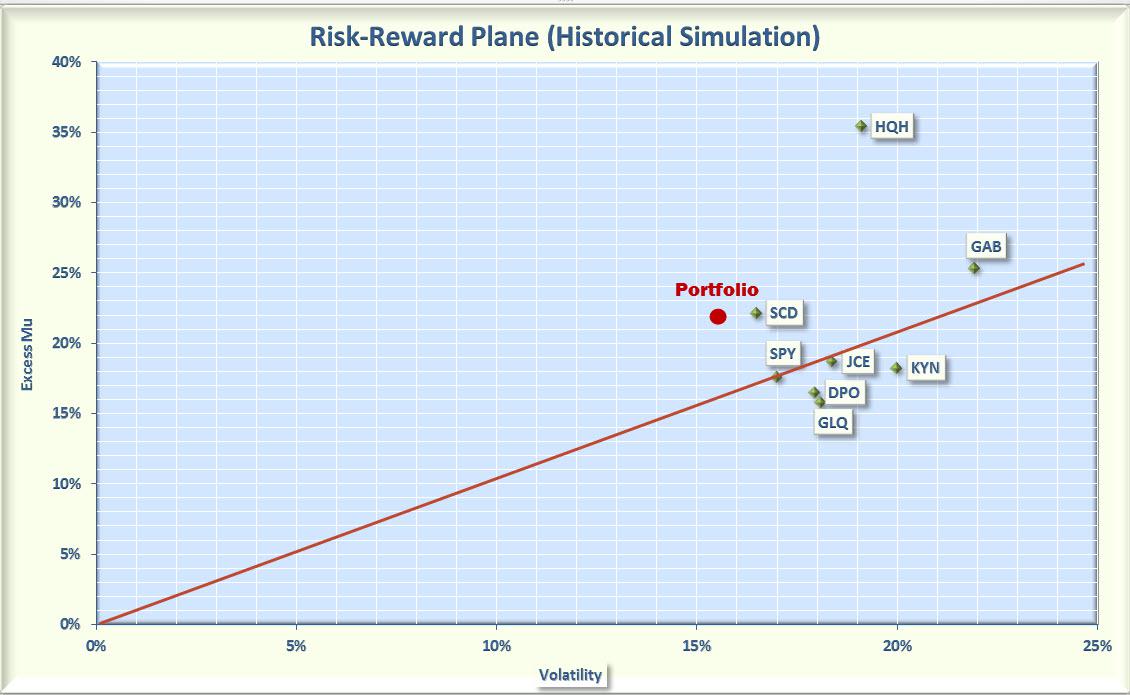
Figure 3. Risk versus Reward for selected CEFs over 3 years
During the past 3 years, the risk adjusted returns were not uniformly better than SPY; several CEFs (GLQ, DPO, and KYN) had Sharpe ratios slightly worse than the SPY. However, overall, the portfolio handily beat the return of the S&P and did so at lower risk. So my "ideal" portfolio remained "ideal" over the past 3 years.
As a final stress test, I re-ran the analysis over the past 12 months, when the S&P experienced a truly impressive bull run. The results are shown in Figure 4.
(click to enlarge)
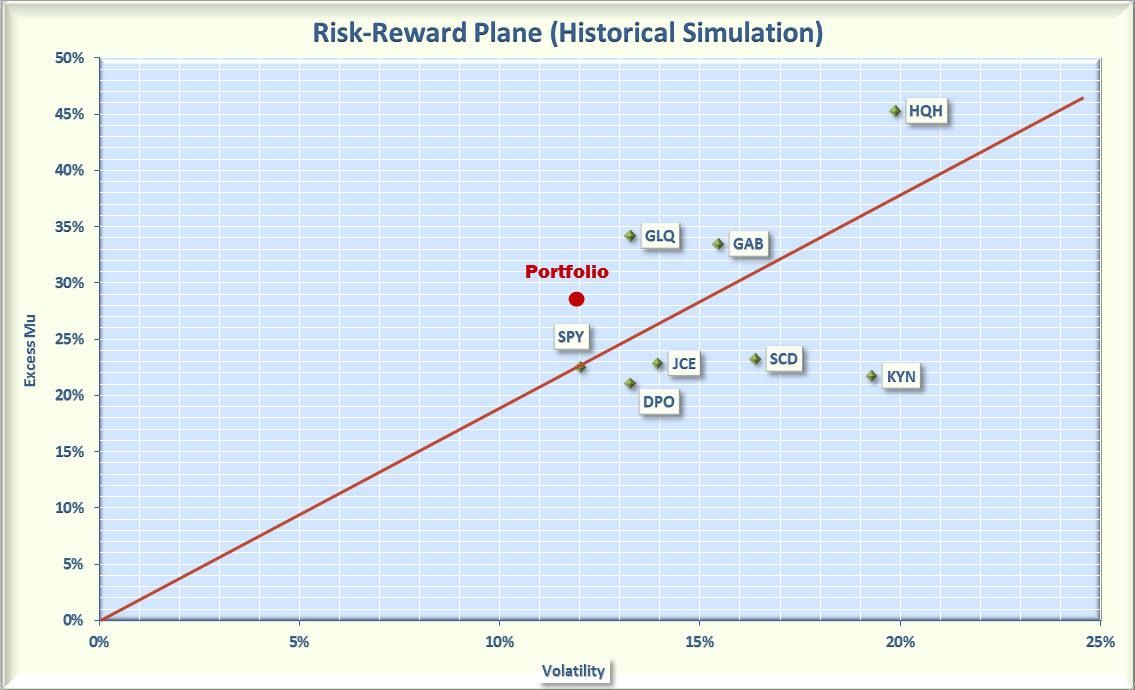
Figure 4. Risk vs. Reward for selected CEFs previous 12 months
Again, the CEFs were not uniformly better, with some outperforming and some underperforming the S&P. However, overall the portfolio has an excellent risk adjusted return, with a return better than the SPY and a volatility just slightly lower than the S&P.
Bottom Line
Over several time periods within the past six years, the CEF portfolio I constructed did, in fact, provide high income with risk adjusted returns better than the S&P 500. This portfolio may or may not continue outperforming in the future, but the general idea of combining CEFs into a diversified, high income portfolio is a technique that retirees should definitely consider.
No comments:
Post a Comment