Own JPMorgan For The Second Best Risk/Reward Profile In The Banking Sector
Based on my analysis, I've calculated that long-term JPMorgan (JPM) shareholders can expect an 18% IRR in my base case scenario, with very limited downside. Only Citigroup (C) has a better risk/reward profile, which I've written about previously here.

This article is the second in a series I'm writing analyzing the return opportunities available in the large cap banking sector. In this series, I take a unique approach to estimating the expected return and downside risk of Bank of America (BAC), Citigroup, JPMorgan, Wells Fargo (WFC), and US Bancorp (USB). This article will focus exclusively on JPMorgan and is broken up into the following sections:
- Results
- Methodology
- Assumptions
- Sensitivity Analysis
- Bottom Line
RESULTS--EXPECT AN 18% IRR IN MY BASE CASE SCENARIO (2ND BEST IN THE LARGE-CAP BANKING SPACE)
In the table below, I show my risk/reward ratio and the Price-to-Tier-1-Common Equity Ratio (P/T1C), stock price, & IRR (Internal Rate of Return) for both my base case and my downside scenario across various holding periods. So for example, if your holding period is 3 years, I expect the stock to be trading at a 1.18x P/T1C ratio, which implies a 3yr target price of $49 and an IRR of 18% including dividends in my base case. In my downside scenario, I would expect the stock to trade at a 0.68x P/T1C ratio, which implies a 3yr target price of $28 and an IRR of positive 1% including dividends. Basically, this implies that dividends over the next three years should be sufficient to provide a very modest positive return even in my downside scenario.

While not shown here, I've completed a similar analysis for the other four large-cap banks, Bank of America, Citigroup, Wells Fargo, and US Bancorp. My analysis on Citi offered the best risk/reward and I intend to complete write-ups for the other banks in the near-future.
METHODOLOGY--A MODIFIED RETURN ON CAPITAL APPROACH TO ESTIMATING LONG-TERM VALUE
For those of you who have read my Citi write-up, much of this methodology section will be repetitive and you can skip down to the Assumptions section. If you're new to my approach, hopefully you'll find this section useful.
I've built a reasonably simple model which forecasts Tier 1 Common Equity Per Share (T1C/shr) as defined under Basel I. I arrive at my T1C/share estimate by projecting a Return on Tier 1 Common Equity (ROT1C), which helps me estimate net income. I then make a few more assumptions around DTA utilization, dividends, buybacks, and share count growth to project year-end T1C/shr. My forecasts are shown below:

I then estimate the stock's value using a range of Price-to-Tier-1-Common Equity Ratios (P/T1C). By multiplying my T1C/shr estimate by a P/T1C ratio, I can generate an estimated price for the stock. Since I don't know what the *right* P/T1C ratio is, I've layered on a probability distribution for each P/T1C ratio across different time periods. One general assumption I have made, is that over time the base case P/T1C ratio will migrate towards the appropriate P/T1C based on my long-term ROT1C assumption. This is discussed in more detail in the Assumptions section, but for JPMorgan, I believe the long-term P/T1C ratio should approach 1.4x. Below, I show my probability distribution assumptions for each period.
Click to enlarge:

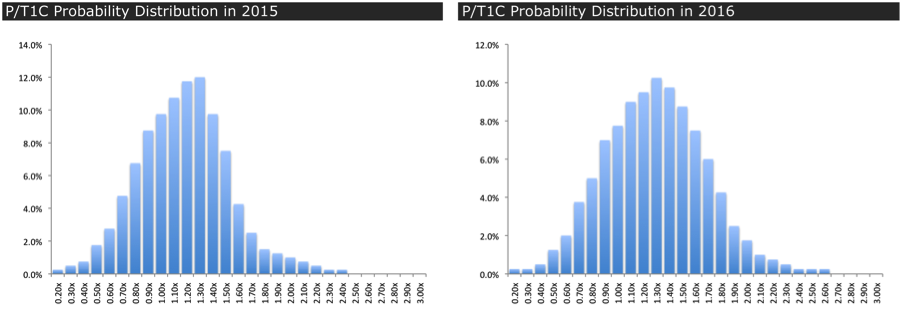

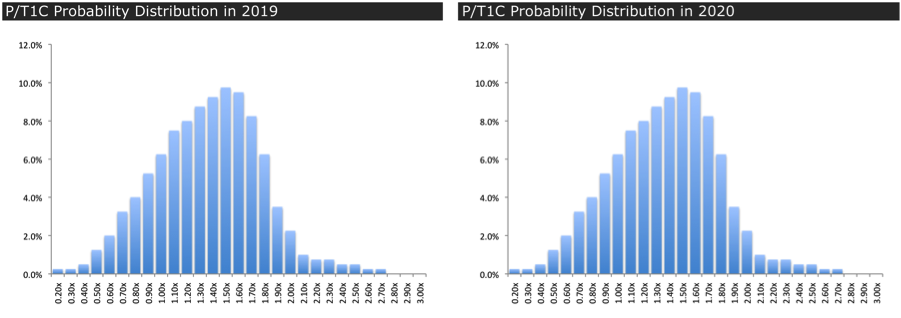
To calculate my base-case estimated P/T1C for each period, I multiply my probability assumption by each P/T1C ratio in the range and sum up the results. This creates a weighted average P/T1C for each period, which is my base case assumption. I can do the exact same math to estimate my base-case price. Below, I show a table which walks through this math for the 2014 period. Note that I use my 2013 year-end T1C/shr estimate of $38 to calculate my 2-year holding period target price of $43.

Once I have my estimated base-case price, I can add the cumulative dividends I expect to receive over that period ($2.70) to the price and calculate an IRR. As my calculation essentially implies that all dividends are paid at the end of the period, it understates the true IRR. Below, I show the IRR calculation for my base-case assumption in 2014 (2-year holding period).
IRR = [(Pricet+n + Cumulative Dividends) / Pricet+0] ^ (1/n) - 1
- Pricet+n = $43
- Cumulative Dividends = $2.70
- Pricet+0 = $32
- n (holding period) = 2yrs
IRR = 19% in my base case scenario w/ a 2-year holding period
To calculate my downside scenario, I again use my probability distribution graph. With this graph I can estimate the bottom 10% P/T1C ratio. ForJPMorgan in 2014, my downside scenario estimates a P/T1C ratio of 0.64x. Said another way, 10% of the time, I expect my P/T1C to be equal to or worse than 0.64x in 2014 (after a 2-year holding period). This analysis is somewhat similar to a VaR calculation in that it doesn't estimate the max downside, but the expected loss at a given probability. Below, I attempt to show where that downside scenario falls on my 2014 probability distribution graph for JPMorgan.
Click to enlarge:

Now on to my actual forecast model. To forecast Tier 1 Common Equity growth, my model essentially starts with 2011 year-end Tier 1 Common Equity and then grows it each year as follows:
Beginning of Period (BOP) T1C
- Add net income
- Add disallowed Deferred Tax Asset (DTA) utilization
- Subtract dividends
- Subtract buybacks
End of Period (EOP) T1C
Additionally, I also forecast the average number of diluted shares in each period. I assume that shares have a natural growth to them of 1.5% from the firm issuing shares to employees but that this growth is offset by buybacks. I discuss the assumptions embedded in my forecast model in more detail in the next section.
ASSUMPTIONS--BUILD IN $5B OF ADDITIONAL LOSSES ABOVE CONSENSUS EST'S RELATED TO THE FAILED CIO HEDGE TRADE
My analysis relies on many, many assumptions and while I've tried to be conservative in making these assumptions, some readers will disagree with my inputs. For this reason, I've made my model available to anyone who wants to do their own analysis and stress the model or look at how less conservative assumptions affect the outcome. Below, I walk through the biggest drivers of my model.
Net Income
To forecast Net Income in 2012-2014, I start with the street's GAAP EPS estimates from Thomson Reuters of $4.53, $5.41, and $5.98, respectively. I then layer on additional losses of $5.0b, $1.0b, and $0.5b, respectively. The additional $5b in losses in 2012 should represent a bad case scenario for the potential losses arising from JPM's failed "hedge" in its CIO division. Just to be clear, my $5b loss is incremental to the losses already built into the consensus forecasts (likely around $2b), implying a total loss related to the failed hedge of approximately $7b. Additionally, my 2013 & 2014 additional losses help compensate for my view that the street tends to be overly optimistic. For 2015-2020, I forecast a Return of Tier 1 Common Equity (ROT1C) for each year. Given that JPMorgan is projected in the near-term to earn an ROT1C north of my projected long-term sustainable ROT1C of 12.1%, my forecast slowly declines from the current levels to 12% as the firm is required to hold more capital and the impact of additional regulations begins to hit the bottom line.
To arrive at my 12.1% long-term sustainable ROT1C, I use history as my guide and perform a modified DuPont Analysis. I look at the last 10yrs of data unmodified (i.e. I leave the 2008-2009 financials losses in without making any adjustments). This assumption essentially assumes that a traditional credit cycle tends to include a crash like we saw in 2008, a reasonably conservative assumption, but not insane considering we have Europe hanging over our heads. My modified DuPont Equation is as follows:
ROT1C = Profit Margin x Asset Turnover / Regulatory Capital
- Profit Margin = Net Income / Revenue (pre-provisions)
- Asset Turnover = Revenue (Pre-provisions) / RWA1
- Regulatory Capital = Tier 1 Common Equity / RWA1
1 RWA = Risk-weighted Assets as defined under Basel 1
In the table below, I show the historical average, one standard deviation up & down, and median for the full history and the last four quarters for each component of my DuPont analysis. The full data series is available as part of the model and was constructed using both CapIQ & Bloomberg data.

Using this table as my historical guide, I then make estimates for what each of these components can be going forward taking into account the many, many regulatory changes that are being implemented across the industry. The biggest change I'm forecasting is that regulatory capital will need to increase almost 30% above the 10yr historical average. Below, I show my estimates and my forecast for long-term sustainable ROT1C of 12.1% based on these estimates.

Long-term Appropriate P/T1C Ratio
Next using the dividend discount model and making a few adjustments I can back into the appropriate P/T1C given an assumed payout ratio, discount rate, and ROT1C. The math works as follows:
Dividend Discount Model: Price = Dividendt+1 / (requity - g)
- where g = ROT1C x (1 - PayOut)
- where Dividendt+1 = Dividendt+0 x (1 + g)
- where Dividendt+0 = T1C x ROT1C x PayOut
P/T1C = ROT1C x PayOut x (1 + g) / (requity - g)
Making the following assumptions:
- PayOut Ratio = 70% (includes both dividends & buybacks)
- Discount rate = 10% (my standard hurdle rate)
- ROT1C = 12.1% as calculated above
Plugging in the assumptions above to my equation, I arrive at a P/T1C ratio 1.4x. In my analysis, I forecast that by 2017, JPMorgan should trade right around that level in my base case (the stock currently trades around 1.0x P/T1C).
Dividends
I have assumed that the firm pays $1.20/shr of dividends during 2012 and continues to increase its dividend payout each year targeting about a 30% payout ratio. My dividend assumptions and payout ratios are shown below.

Stock Buybacks
I have assumed the firm makes no share repurchases during 2012 as it builds capital following its failed hedge trade in the CIO division. In 2013, I forecast that the firm resumes its share buyback program repurchasing a modest $3b of stock. From 2014 onward, I have assumed the firm gets more aggressive about its repurchases. My buyback assumptions and buyback payout assumptions are shown below.

Disallowed Deferred Tax Asset Utilization
I have assumed the firm is able to utilize essentially all of its $2.4b of disallowed DTA in 2012. Unlike Citi and Bank of America which accumulated large NOLs during the financial crisis, JPMorgan's relatively successful navigation of the crisis resulted in a much smaller build up of deferred tax assets (DTAs). This means that this particular input is much less relevant for JPMorgan's forecast than it is for Citi or Bank of America. It also means that all else equal, the growth in T1C will likely be slower for JPMorgan than Bank of America and Citi.
Probability Distributions for P/T1C Ratios
As I discussed above, I've made a series of assumptions around the likelihood of each P/T1C ratio being the correct future ratio. I generally assumed that the weighted average P/T1C would migrate toward the appropriate long-term P/T1C of 1.4x that I calculated using the dividend discount model above. This, of course, may not happen, but feel free to change my probability distributions as you see fit.
SENSITIVITY ANALYSIS--THE LONG-TERM SUSTAINABLE ROT1C EST IS THE MOST CRITICAL FACTOR FOR ESTIMATING VALUE
Lower Terminal ROT1C Estimate to 10% (vs 12.1% Currently)
In the table below, I show my updated return profile if I cap my sustainable long-term ROT1C at 10% (vs 12.1% previously). I have updated by P/T1C distribution tables by shifting my probabilities 0.3x to the left. This essentially targets a long-term P/T1C of 1.1x, which is roughly what you'd expect the multiple to be if the ROT1C drops. My average base-case IRR over all time periods falls to 7% (vs 18% previously). While this is a significantly lower IRR, investors with a long-term time horizon can still expect a low double-digit return and relatively limited downside.

3x Larger Additional Losses in 2012-2014
In the table below, I show how my returns are affected if I triple my additional losses for each of the next three years. In this scenario, I'm forecasting additional losses in 2012-2014 of $15b, $3b, and $1.5b, respectively (vs $5.0b, $1.0b, and $0.5b previously). Again, my loss estimates are deducted from the street consensus estimates. My average base-case IRR over all time periods falls to 14% (vs 18% previously).

Bottom 5% Expected Returns
In the table below, I update my return analysis looking at the bottom 5% of expected returns (my previous downside scenario was the bottom 10%). This provides some perspective on what kind of returns investors should expect if things really get ugly. The key take-away is that with a long enough time horizon, 4yrs+, even in a very difficult environment you should be able to generate a very modest return and avoid a loss of principal, based on my model.

Upside--Stock Trades At Top 10% Of My Probability Distribution
While I'm much more concerned with downside risk than I am with upside potential, it is still helpful to have an understanding of the return possibilities in a very bullish upside scenario. Using the same methodology I used to forecast the potential outcome in the bottom 10% scenario, I can alternatively look at the top 10% scenario. The table below looks at this outlier scenario to the upside. Under this very bullish scenario, the stock could generate IRRs approaching 30% over a 3 year period.

BOTTOM LINE--JPM OFFERS THE SECOND MOST COMPELLING RISK/REWARD PROFILE IN THE LARGE-CAP BANK SPACE
JPM should be viewed by investors with a long-term horizon as an exceptional investment opportunity. Additionally, the recent missteps by the CIO division, which caused the stock to retreat almost 25% from its pre-announcement level, presents a compelling entry point. I thinkJPMorgan is the second most attractive stock in the large-cap bank universe, second only to Citigroup, which I believe presents the best combination of upside potential and downside protection. Bottom line, I think both JPM & C are the large-cap stocks to own.
As always, your comments and questions are appreciated and thanks for reading.
By Chris Moreno
No comments:
Post a Comment